Category: Infotainment

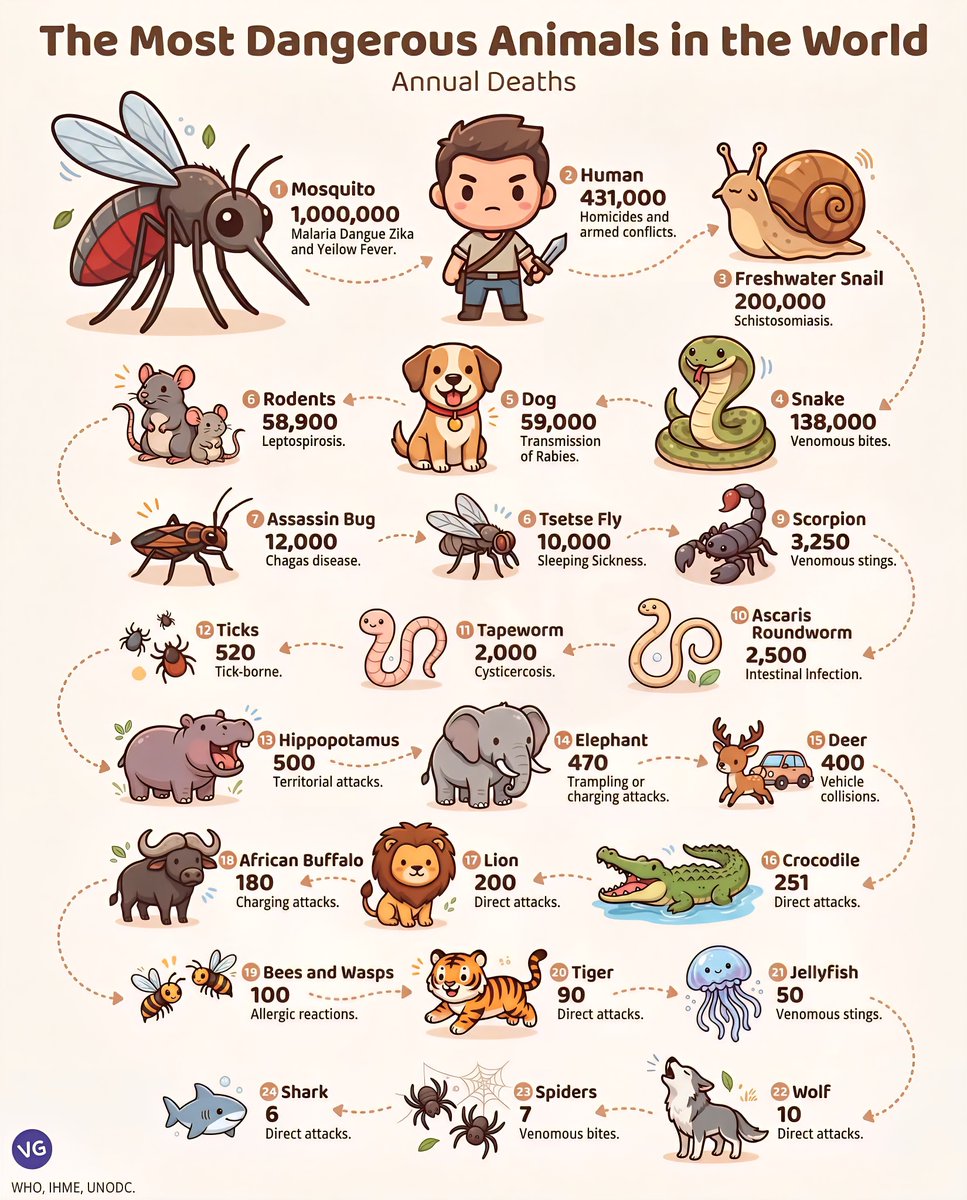
  • Top 10 Most Dangerous Animals in the World by Annual Deaths

    Top 10 Most Dangerous Animals in the World by Annual Deaths

    Dangerous Animals

    Top 24 Deadliest Animals in the World According to 2025 Data

    1. Mosquitoes – The Deadliest Creatures on Earth

    Mosquitoes are responsible for approximately 1 million deaths annually, making them the deadliest animal. Their ability to transmit diseases such as malaria, dengue, Zika, and chikungunya turns these tiny insects into deadly vectors. Different regions, especially tropical and subtropical areas, see higher incidences of mosquito-borne illnesses, emphasizing the importance of mosquito control and protection measures.

    2. Humans – The Unexpected Threat

    Surprisingly, humans themselves cause around 431,000 deaths each year. This figure includes fatalities from violence, accidents, and health-related issues stemming from lifestyle choices, conflicts, and environmental impacts. Our own species continues to be a major contributor to global mortality, highlighting ongoing issues like violence, road accidents, and systemic health disparities.

    3. Freshwater Snails – Silent Spreaders of Disease

    While small and often overlooked, freshwater snails contribute to approximately 200,000 deaths each year. They are notorious for spreading schistosomiasis (bilharzia), a disease affecting millions worldwide, primarily in regions with poor sanitation and limited access to clean water sources.

    4. Snakes – Nature’s Venomous Threats

    With about 138,000 fatalities annually, venomous snakes remain a significant danger in many parts of the world, especially in Africa, Asia, and Latin America. Snakebite envenomation can cause severe tissue damage, paralysis, and death if not treated promptly. Efforts to improve access to antivenom are critical in reducing these fatalities.

    5. Dogs – Man’s Best Friend or Deadly Foe?

    While beloved as pets, dogs are responsible for roughly 59,000 deaths each year due to rabies transmission and attacks, particularly in regions where vaccination programs are lacking. Rabies is a preventable disease, but strict vaccination and public health strategies are necessary to curb its impact.

    6. Rodents – Small but Dangerous

    Rats and mice contribute to approximately 58,900 deaths annually through disease transmission. They can carry pathogens that cause plague, leptospirosis, and hantavirus, making rodents a significant public health threat, especially in densely populated urban areas.

    7. Assassin Bugs – The Blood-Feeding Culprits

    Responsible for around 12,000 deaths each year, assassin bugs are vectors for Chagas disease, which affects millions globally. They stealthily transmit Trypanosoma cruzi, leading to chronic health issues if untreated.

    8. Tsetse Flies – Vectors of African Sleeping Sickness

    Tsetse flies cause about 10,000 deaths per year through the transmission of sleeping sickness (trypanosomiasis). This disease impacts populations in sub-Saharan Africa, causing fever, anemia, and neurological problems.

    9. Scorpions – Poisonous Pests

    Scorpions are responsible for approximately 3,250 deaths annually worldwide. Their venom can cause severe pain, illness, and, in some cases, death, especially in regions lacking immediate medical care.

    10. Roundworms – Parasites in Our Bodies

    Ascaris roundworms contribute to around 2,500 deaths each year. These parasitic worms infect millions, especially in impoverished regions where sanitation is inadequate, leading to malnutrition and intestinal complications.

    11. Tapeworms – Another Parasitic Threat

    Tapeworm infections are linked to roughly 2,000 deaths annually. They can cause nutritional deficiencies, neurological issues, and cystic diseases if not diagnosed and treated.

    12. Ticks – The Carrying Menace

    Responsible for about 520 deaths each year, ticks are vectors for diseases like Lyme disease and Rocky Mountain spotted fever, which can be fatal without prompt treatment.

    13. Hippopotamuses – Surprisingly Dangerous

    Despite their baleen and herbivorous reputation, hippos cause approximately 500 deaths annually in Africa, often through aggressive encounters or territorial disputes.

    14. Elephants – Large but Deadly

    Elephants, especially in Africa and Asia, are linked to about 470 fatalities per year, typically due to defensive attacks or human-elephant conflicts.

    15. Deer – Unpredictable and Potentially Deadly

    Deer are responsible for approximately 400 deaths annually, mainly through vehicle collisions resulting in accidents and injuries.

    16. Crocodiles – Masters of Ambush

    Crocodiles cause around 251 deaths yearly, primarily in Southeast Asia, Australia, and Africa. They are skilled predators and pose a serious threat to humans near water bodies.

    17. Lions – Iconic But Dangerous Predators

    Lions, with approximately 200 deaths per year, often attack humans in rural Africa, especially in areas where human settlements intersect with wildlife habitats.

    18. African Buffalo – The Dangerous Bovid

    Responsible for around 180 deaths annually, African buffalo are known for their unpredictable nature and aggressive behavior when threatened.

    19. Bees and Wasps – Stinging Hazards

    While often considered minor insects, bees and wasps cause about 100 deaths each year due to allergic reactions and venomous stings.

    20. Tigers – Apex Predators

    Tigers are responsible for roughly 90 fatalities annually, mainly in India and Southeast Asia, often through attacks on humans in rural or forested areas.

    21. Jellyfish – The Ocean’s Touch of Death

    Jellyfish cause about 50 deaths per year worldwide due to their venomous stings, which can lead to cardiac failure in severe cases.

    22. Wolves – The Howling Threat

    Wolves are linked to about 10 deaths annually, mostly in regions where reintroduction and human encroachment have increased conflicts.

    23. Spiders – Often Misunderstood

    Spiders are responsible for roughly 7 deaths per year. While most are harmless, venomous species like the Black Widow can cause severe health issues.

    24. Sharks – The Ocean’s Predators

    Shark attacks result in about 6 fatalities per year, with most incidents occurring in coastal waters where humans and sharks share habitats.


    Sources: World Health Organization (WHO), Institute for Health Metrics and Evaluation (IHME), United Nations Office on Drugs and Crime (UNODC), via VG, 2025 data.

    Understanding these animals and the risks they pose is essential for public safety and conservation efforts worldwide.

  • Top Trillion Dollar Companies in the World

    Top Trillion Dollar Companies in the World

    Top Trillion-Dollar Companies Dominating the Global Market in 2025

    Image of global financial centers and tech icons representing major companies

    NVIDIA – The Tech Titan Surpassing $5 Trillion

    Leading the list once again is NVIDIA, the Silicon Valley powerhouse with a total valuation of approximately $5.009 trillion. Known for revolutionizing graphics processing units (GPUs), NVIDIA has expanded its influence into AI, gaming, and data centers. The company’s innovative hardware and strategic acquisitions have cemented its position at the pinnacle of the tech industry, making it the most valuable company in the world as of 2025.

    Apple – The Iconic Consumer Technology Company Nearing $5 Billion

    Apple continues to hold its ground with a valuation hovering around $4.891 trillion. The company’s flagship products—iPhone, iPad, Mac, and its growing services division—have driven consistent growth. Apple’s brand loyalty and ecosystem connectivity have created a solid revenue base, keeping it among the giants in the trillion-dollar club.

    Alphabet – The Powerhouse of Digital Advertising and Cloud Services

    Google’s parent company, Alphabet, boasts a valuation of roughly $3.902 trillion. Its dominance in search, YouTube, and online advertising remains unchallenged. Additionally, Alphabet’s investments in cloud computing, autonomous vehicles, and AI research continue to fuel its expanding valuation.

    Microsoft – A Leader in Software, Cloud, and AI

    Microsoft’s comprehensive portfolio—ranging from software and Windows to Azure cloud services—has reached a valuation of about $2.835 trillion. The tech giant’s push into enterprise solutions and its growing AI offerings have propelled it into the trillion-dollar valuation tier this year.

    Amazon – E-commerce and Cloud Computing Behemoth

    Amazon has maintained its position with a valuation around $2.496 trillion. Besides its dominance in global e-commerce, Amazon Web Services (AWS) remains a critical revenue generator, fueling the company’s growth and innovation in logistics, AI, and healthcare.

    Taiwan Semiconductor Manufacturing Company (TSMC) – The Semiconductor Powerhouse

    Valued at approximately $2.092 trillion, TSMC is the leading semiconductor foundry in the world. As demand for chips skyrockets due to AI, 5G, and electric vehicles, TSMC’s strategic manufacturing capabilities keep it among the top trillion-dollar companies.

    Broadcom – The Chip and Infrastructure Expert

    With a valuation near $1.817 trillion, Broadcom specializes in semiconductor and infrastructure software solutions. Its diverse product lines from networking to data centers play a vital role in supporting global digital infrastructure.

    Saudi Aramco – Oil Giant Reinvented

    Saudi Aramco, the oil and gas behemoth, is valued at approximately $1.729 trillion. Despite the push toward renewable energy, Aramco’s massive reserves and refining capacity sustain its ranking among the world’s most valuable companies.

    SpaceX – Reaching for the Stars

    SpaceX, led by Elon Musk, has a valuation of around $1.515 trillion. Its advancements in reusable rocket technology and ambitious plans for Mars colonization have elevated its standing and investor confidence.

    Meta Platforms – Social Media Titan Expanding Horizons

    Facebook’s parent company, Meta, is valued at roughly $1.510 trillion. Its investments in virtual reality (VR), augmented reality (AR), and the metaverse are promising avenues for future growth.

    Tesla – Innovative Electric Vehicle Manufacturer

    Tesla’s electrification revolution continues, with the company valued at about $1.236 trillion. Its expanding global presence, battery innovations, and energy solutions are key drivers behind its valuation.

    Samsung – South Korea’s Electronic Powerhouse

    Samsung Electronics has a valuation of roughly $1.123 trillion. The company’s leadership in smartphones, semiconductors, and consumer electronics cements its status on this list.

    Berkshire Hathaway – The Conglomerate of Warren Buffett

    With a valuation near $1.067 trillion, Berkshire Hathaway’s diversified investments in insurance, energy, and manufacturing keep it firmly within the trillion-dollar club under Warren Buffett’s strategic guidance.

    Eli Lilly – Biotech and Pharmaceutical Innovator

    Eli Lilly, a pioneer in biotech, now holds a valuation around $1.066 trillion, driven by breakthroughs in oncology, immunology, and neuroscience.

    Micron Technology – Memory and Storage Solutions

    Micron stands at approximately $1.040 trillion, thanks to its advancements in memory storage and DRAM markets, vital for computing and mobile devices.


    Note: The values listed reflect the latest figures for 2025, based on numerous financial analyses and market reports. The list highlights how technology, energy, biotech, and industry giants continue to shape the global economy.

    Sources: CompaniesMarketCap, latest financial disclosures, and industry analyses.

    For ongoing updates, follow latest market trends on Twitter.

  • Countries Where Earning $1,000 Takes the Longest Time

    Countries Where Earning $1,000 Takes the Longest Time

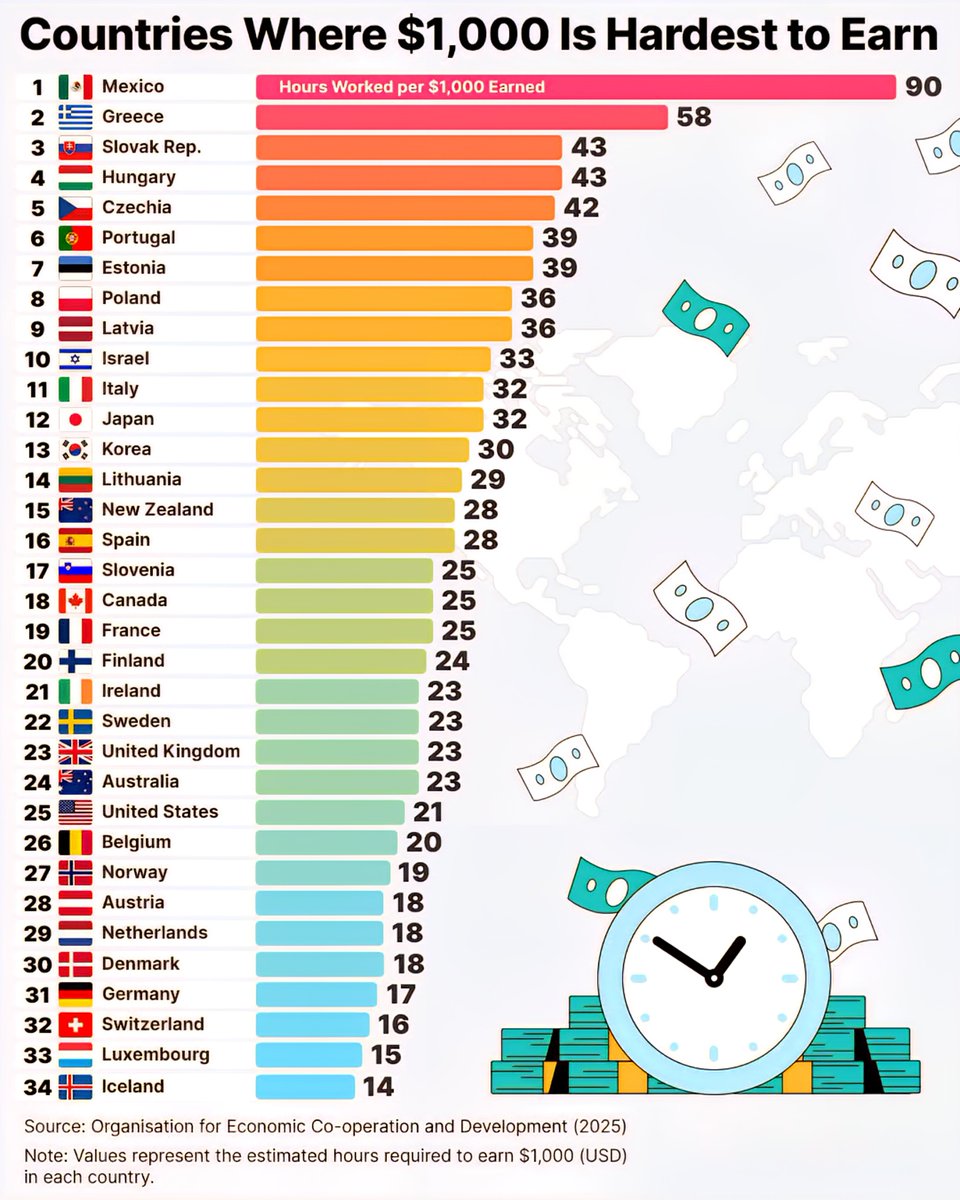
    Countries Where Earning $1,000 Takes the Longest

    Mexico — 90 Hours

    According to recent data, Mexico tops the list with workers needing approximately 90 hours to earn $1,000. The country’s lower average wages significantly impact the amount of time required for income, reflecting ongoing economic challenges and the disparities in earning power across the nation.

    Greece — 58 Hours

    In Greece, workers spend around 58 hours to accrue $1,000. Despite recent economic reforms and recovery efforts, wages in Greece remain relatively modest compared to other European nations, making it a difficult country to earn substantial income quickly.

    Slovakia and Hungary — 43 Hours

    Both Slovakia and Hungary require approximately 43 hours of work to make $1,000. These countries, situated in Central Europe, have seen steady economic growth; however, wage levels still lag behind Western European standards.

    Czechia and Portugal — 42 and 39 Hours Respectively

    Czechia hits the 42-hour mark, while Portugal requires about 39 hours. These nations have stabilized their economies post-pandemic, yet average wages remain a hurdle for many workers aiming to boost their earnings efficiently.

    Estonia and Poland — 39 and 36 Hours

    Estonia, known for its digital innovation and growing tech sector, still sees workers spending roughly 39 hours per $1,000. Poland’s working hours for the same sum is about 36 hours, underscoring the ongoing wage gap within the European Union.

    Latvia and Israel — 36 and 33 Hours

    In Latvia, earning $1,000 takes about 36 hours. Conversely, in Israel, workers need roughly 33 hours, reflecting higher wages and purchasing power within its tech and pharmaceutical industries.

    Italy and Japan — 32 Hours

    Italian workers, with an average wage, can expect to work approximately 32 hours for $1,000. Japan’s efficient economy and high wages mean workers need about the same amount of time, highlighting their advanced economic development.

    South Korea and Lithuania — 30 and 29 Hours

    South Korea stands at around 30 hours, while Lithuania requires about 29 hours. These countries, both with strong industrial sectors, continue shifting towards more advanced economies with rising wages.

    New Zealand, Spain, and Slovenia — 28 to 25 Hours

    New Zealand and Spain both hover around 28 hours, with Slovenia slightly lower at 25 hours. These nations benefit from diverse economies, strong service sectors, and committed labor markets.

    Canada, France, and Finland — 25 to 24 Hours

    Canadian, French, and Finnish workers see a similar trend, needing about 25 hours or less to make $1,000. Their high living standards and robust social programs are reflected in balanced wage structures.

    Ireland, Sweden, and United Kingdom — Around 23 Hours

    These leading European countries require approximately 23 hours of work. As mature economies, their residents often enjoy higher wages and better working conditions.

    Australia and United States — 23 and 21 Hours

    Down under and across the Atlantic, Australians and Americans need about 23 and 21 hours respectively. Their large economies and high productivity levels contribute to relatively shorter earning times.

    Wage Gaps and Economic Indicators

    While the United States, Australia, and parts of Europe struggle to keep the earning hours below 25, countries like Belgium, Norway, Austria, and the Netherlands are seeing workers earn $1,000 in even fewer hours — nine to twenty hours in some cases. The top of the list, Iceland with just 14 hours needed, Highlights higher average wages and living costs in these nations.

    Why Some Countries Take Longer

    Multiple factors influence these figures: wage levels, cost of living, economic stability, and industry diversification. Countries with lower wages, such as Mexico and Greece, require more working hours, whereas wealthier nations with higher wages such as Iceland or Luxembourg have workers earning $1,000 in significantly less time.

    The Broader Economic Picture

    This data sheds light on ongoing global income disparities. It serves as a reminder that in many parts of the world, particularly in Latin America, southeastern Europe, and parts of Asia, earning even a modest sum like $1,000 can be an arduous process. Conversely, highly developed nations continue to see workers reaching income milestones faster, supported by higher productivity and wages.

    This ongoing analysis underscores the importance of economic growth, wage policies, and social infrastructure in shaping workers’ lives around the world in 2025.

    Source: Organisation for Economic Co-operation and Development (OECD), 2025

  • Top Countries Where Over 90 Percent of People Speak English

    Top Countries Where Over 90 Percent of People Speak English

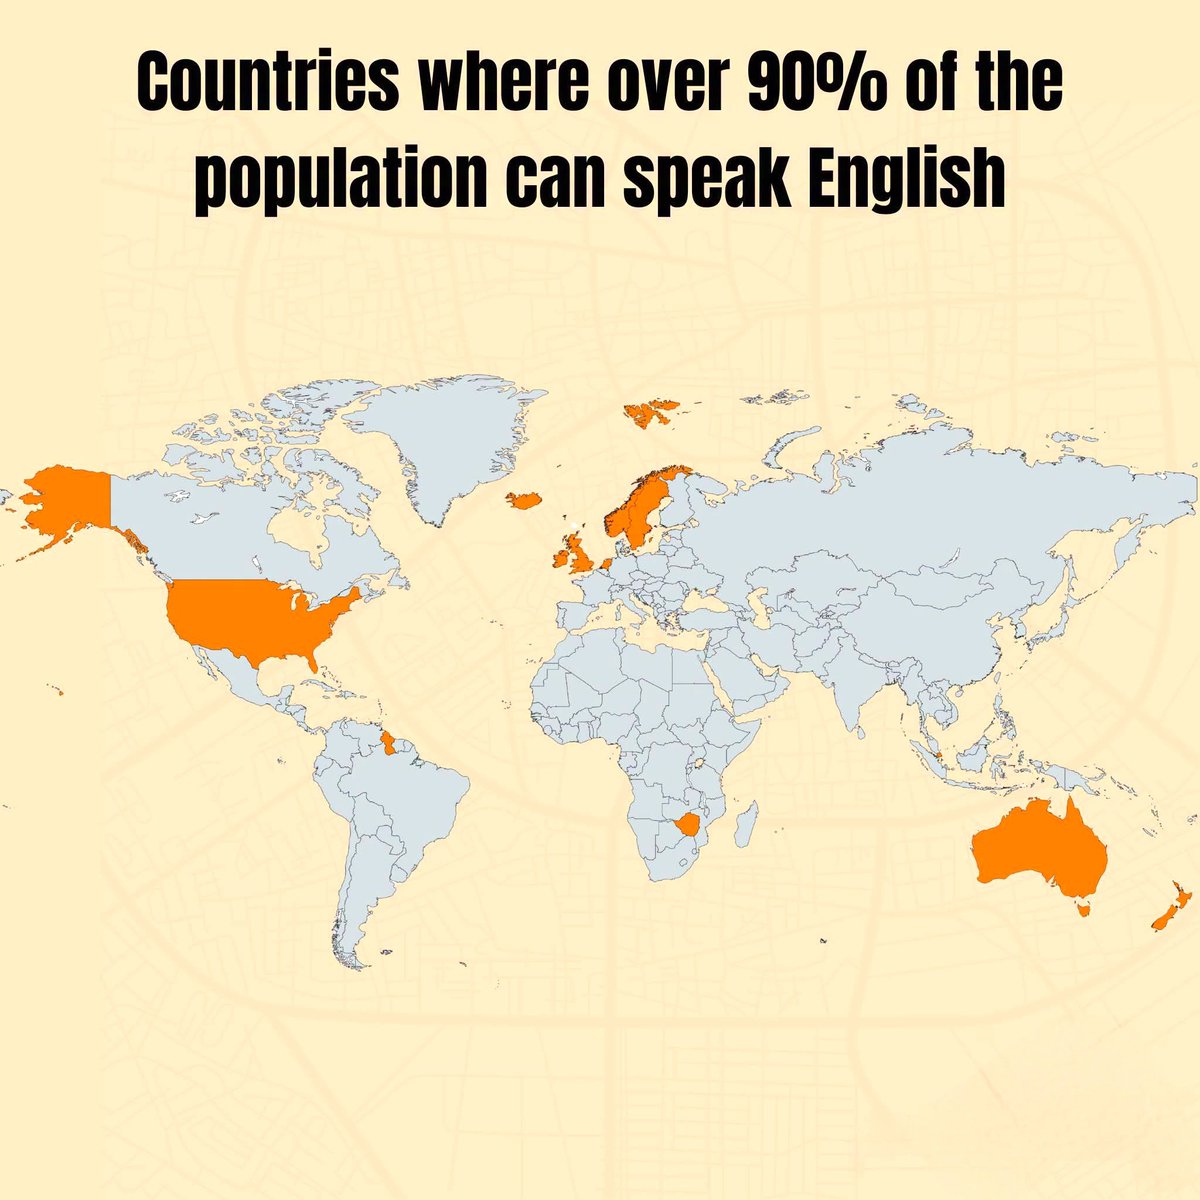
    Countries with Over 90% English Fluency in 2025

    ![People enjoying coffee at a bustling street in Singapore](https://pbs.twimg.com/media/HO Hva0FbUAAiRy1.jpg)

    1. Singapore: A Bilingual Hub with a 95% English Fluency Rate

    Singapore continues to set the standard for English proficiency in Asia, with approximately 95% of its population able to speak the language fluently. The city-state’s education policies emphasize bilingualism—English alongside a mother tongue—making it a global business and cultural center. English is the medium of instruction in schools, government communication, and is widely spoken in daily life, fostering an environment where locals navigate seamlessly with international visitors and expatriates.

    2. Philippines: A Rich Cultural Tapestry with 92% English Speakers

    The Philippines boasts an impressive 92% of its population fluent in English, second only to its native Tagalog and regional languages. English is an official language, deeply embedded in the country’s education system and government operations. Widespread use in business, media, and everyday communication has helped the country emerge as a major outsourcing hub, attracting multinational companies seeking skilled English-speaking professionals. The Philippines’ unique blend of local languages and English creates a vibrant linguistic landscape.

    3. Singapore: The Global English Powerhouse in Asia

    Singapore’s strategic focus on English as its lingua franca and the country’s multicultural makeup contribute to its roughly 95% fluency rate. From kindergarten classrooms to top-tier universities and professional settings, English functions as the connective tissue that supports economic growth and international diplomacy. Its government promotes English literacy to enhance global competitiveness, making it one of the most linguistically proficient nations in the world.

    4. Nigeria: A Growing Nation with 91% English Proficiency

    Nigeria, Africa’s most populous country, has seen a significant rise in English speakers, with approximately 91% of the population able to communicate fluently. English remains the official language and is the primary language in government, education, and media. Despite linguistic diversity, the widespread use of English aids national unity and positions Nigeria as a key player in regional commerce and diplomacy. The country’s large youth population drives its expanding English fluency, fortifying its global presence.

    5. Malaysia: A Multicultural Economy with 90% English Fluency

    In Malaysia, about 90% of the population can speak English, especially in urban centers like Kuala Lumpur. The country’s historical ties with Britain and deliberate policy initiatives have made English a crucial second language. It is common in higher education, business dealings, and tourism. The country’s multicultural ethos, combined with strong government support for bilingual education, ensures a high level of English competence that facilitates international trade and attracts foreign investment.

    6. Other Notable Countries

    • India: Although the percentage of fluent English speakers reaches around 88%, the extensive use of English in higher education, technology, and professional sectors positions India as a global English hub.
    • Kenya: Approximately 89% of Kenyans are proficient in English, aiding its standing as an East African economic hub.
    • United Arab Emirates: With an estimated 92%, the UAE’s emphasis on English in business and tourism sectors makes it a vital node in global commerce.

    Final Thoughts

    These nations exemplify how strategic focus on English language education and official recognition can create vibrant, multilingual societies with high levels of English fluency. As globalization accelerates, the importance of linguistic proficiency in facilitating international business, diplomacy, and cultural exchange continues to grow, making these countries key players on the world stage in 2025.

  • Top Countries Capable of Self-Sufficient Food Production in 2025

    Top Countries Capable of Self-Sufficient Food Production in 2025

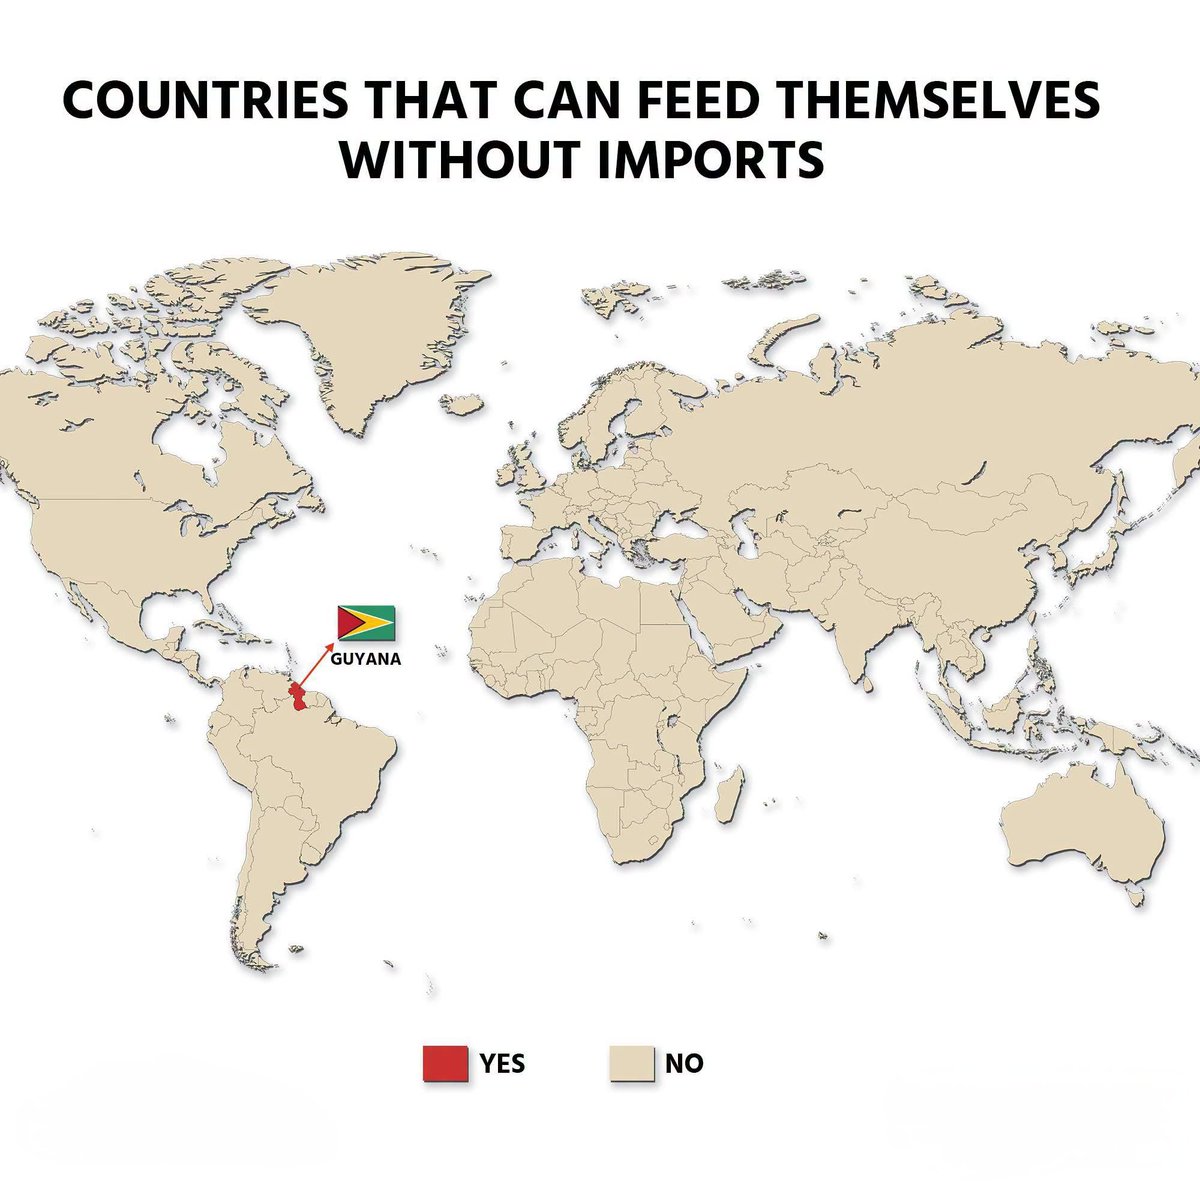
    Guyana: The World’s Leading Self-Sufficient Food Producer

    In 2025, a groundbreaking study by Nature Food reveals that Guyana stands alone as the only country capable of feeding its population entirely through domestic food production. This remarkable achievement highlights Guyana’s robust agricultural sector, which manages to sustain the nation without any reliance on food imports.

    China and Vietnam: Near Self-Sufficiency with Major Food Groups Covered

    While Guyana is the sole leader in total self-sufficiency, China and Vietnam are not far behind. Both nations secure six out of the seven critical food groups, underscoring their advanced agricultural industries. Their impressive self-sufficiency levels reflect extensive investments in domestic farming and fisheries, ensuring food security for their populations.

    The Seven Essential Food Groups: What Countries Are Covering

    The report emphasizes seven core food categories that are vital for national food independence:

    • Fruits
    • Vegetables
    • Legumes
    • Starchy Staples
    • Meat
    • Fish
    • Dairy

    Achieving self-sufficiency across all these groups is no small feat, requiring diversified farming practices, sustainable resource management, and robust infrastructure.

    Guyana’s Secret to Success: A Comprehensive Approach

    Guyana’s ability to produce all food groups domestically results from a strategic focus on diversified agriculture. The country benefits from fertile land, favorable climate conditions, and government policies that promote sustainable farming practices. These efforts have enabled Guyana to maximize crop yields and livestock productivity, reducing dependence on imports.

    China’s Agricultural Milestones

    Despite facing challenges such as urbanization and limited arable land, China has made significant progress. Its focus on modernizing agriculture, embracing technology, and improving supply chains has helped it achieve remarkable self-sufficiency in fruits, vegetables, grains, and meats. China’s vast domestic market also supports large-scale farming initiatives that bolster food security.

    Vietnam’s Rapid Agricultural Growth

    Vietnam has experienced a rapid rise in food self-sufficiency by fostering innovative farming techniques and expanding aquaculture. Its coastal regions provide abundant fish and seafood, making it a leader in marine food production. Additionally, Vietnamese farmers have adopted sustainable practices to enhance crop yields in fruits, vegetables, and legumes.

    The Importance of Self-Sufficiency

    Achieving high levels of food independence offers numerous benefits, including resilience against global supply chain disruptions, price stability, and increased national security. Countries that can feed themselves effectively are better equipped to withstand economic shocks and geopolitical tensions that threaten international food markets.

    Challenges for Countries Striving Towards Self-Sufficiency

    While some nations excel in specific food groups, reaching total self-sufficiency remains complex. Challenges include climate change, land degradation, water scarcity, and rising urban populations that strain agricultural resources. Countries aiming for independence must foster innovation, invest in sustainable technologies, and promote policies that support diverse food production.

    The Future of Global Food Self-Sufficiency

    As 2025 progresses, more countries are recognizing the strategic importance of self-sufficiency. With advances in agricultural technology, renewable energy integration, and sustainable practices, the goal of independent food systems becomes increasingly attainable. However, comprehensive planning and international cooperation remain essential for sustainable progress.

    Self-sufficiency in food production not only secures a nation’s health and stability but also paves the way for more resilient economies capable of withstanding global uncertainties.

  • Top Origins of South American Country Names Explained

    Top Origins of South American Country Names Explained

    Uncovering the Origins of South American Country Names: A Deeper Dive

    Image of a map of South America

    1. Argentina: Named for Silver Treasures

    The name “Argentina” derives from the Latin word argentum, meaning silver. Early explorers, inspired by the continent’s rich deposits of silver, coined the term, which eventually came to refer to the entire nation. The allure of silver deposits and the shiny metal’s significance in trade and ornamentation cemented this name in history.

    2. Brazil: Rooted in the Brazilwood Tree

    “Brazil” gets its name from the Brazilwood tree (pau-brasil), which was highly valued by European traders for its exquisite red dye. This dense, hardwood tree was extensively harvested during the colonial era, making it a pivotal resource and the namesake of the country. The term reflects the profound influence of the country’s natural resources on its identity.

    3. Colombia: Honoring Christopher Columbus

    The name “Colombia” pays homage to Christopher Columbus, the Italian explorer credited with opening the Americas to European colonization. Derived from his surname, the nation’s name was adopted in the 19th century to symbolize independence and a new identity rooted in exploration and discovery.

    4. Venezuela: Little Venice on the Shores

    Venezuela, meaning “Little Venice,” was given by Spanish explorers who found the region’s stilted dwellings reminiscent of Venice, Italy. Early explorers were struck by the lake dwellings and the network of waterways, leading to the poetic nickname that encapsulates the country’s unique geography.

    5. Peru: Named After a River or the Moche God Birú

    The name “Peru” is believed to have originated from the local Quechua or Aymara words, possibly linked to the Birú River near the Spanish settlement of Santa María de Buena Vista. Some theories suggest it references a local deity or the indigenous word for the land, highlighting the region’s ancient roots.

    6. Ecuador: Marking the Equator

    Ecuador’s name is a direct nod to its geographical position straddling the Equator. When the Spanish arrived, they named the land after this prominent line of latitude, which weaves through the country, influencing its climate and geography.

    7. Bolivia: In Honor of Simón Bolívar

    Bolivia was named after Simón Bolívar, the revered South American liberator who played a key role in gaining independence from Spanish rule. The naming honors his leadership and the ideals of freedom and unity he championed across the continent.

    8. Guyana: Land of Many Waters

    Guyana’s name stems from indigenous languages, meaning “Land of Many Waters,” a fitting name considering its vast river systems and lush natural landscapes. The country’s abundant waterways have shaped its culture and economy.

    9. Suriname: Home of the Surinamese People

    The name Suriname is believed to originate from an indigenous word for the local people or a local tribe. It emphasizes the country’s rich indigenous heritage and the diverse ethnic groups that inhabit it.

    10. Paraguay: Named After the River

    Paraguay’s name is derived from the Guarani words paraguay, meaning “many waters” or “river with brine”—a nod to the Nandutí River that traverses the country. The river’s significance is woven into the nation’s identity and history.

    11. Uruguay: The River of the Painted Birds

    Uruguay’s name likely stems from the Guarani words ure (bird) and guay (river), translating to “river of the painted birds” or “river of the uru,” reflecting its rich birdlife and natural beauty. The country’s name celebrates its vibrant ecosystems.

    12. Chile: Land of Snow and Cold

    Chile’s name is believed to originate from the indigenous Mapuche word Chilli, meaning “where the land ends” or “the deepest point of the Earth.” The country’s extensive mountain ranges and glaciers make “Land of Snow” an apt description, emphasizing its icy landscapes.


    South America’s rich tapestry of history and indigenous culture is etched deeply into its country names. Many of these names point to natural resources, geographic features, or legendary figures that continue to define the continent’s identity.


    Note: The names of these countries reveal a blend of indigenous heritage, natural features, and colonial history, each contributing to the fascinating mosaic of South America’s cultural landscape.

  • Top Countries with the Highest Food Export Surplus

    Top Countries with the Highest Food Export Surplus

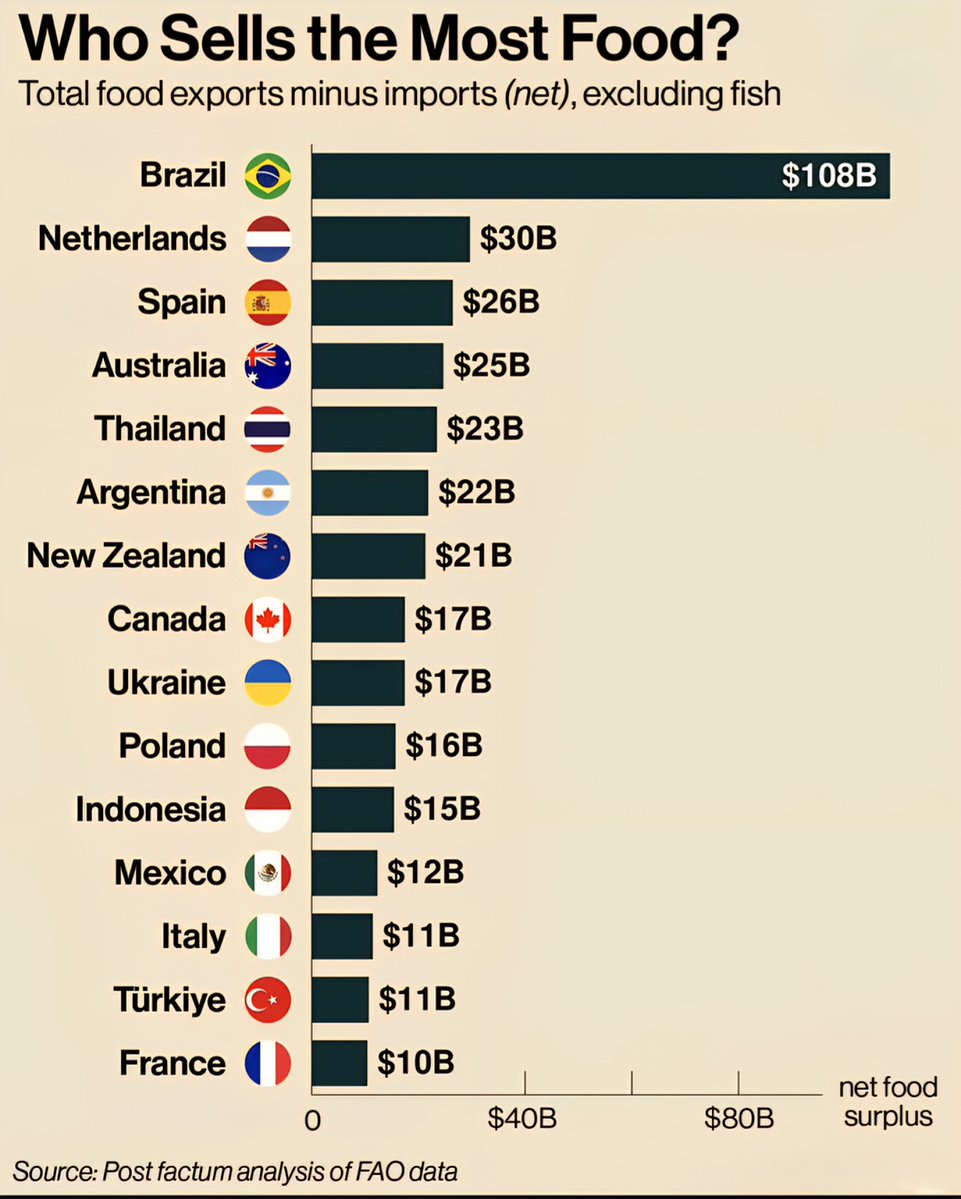
    Top Food Exporters in 2025: A Global Snapshot

    World Food Export Leaders

    1. Brazil Dominates the Global Food Market with a Massive Lead
    Brazil continues to reign supreme as the top food exporting nation in 2025, with a staggering net export value of $108 billion. This impressive figure showcases Brazil’s substantial agricultural output and its critical role in supplying the world’s food needs. The nation’s robust agrarian sector, spanning soybeans, beef, coffee, and poultry, contributes heavily to its export dominance. Brazil’s strategic investment in sustainable farming practices and infrastructure has further cemented its position on the global stage.

    2. The Netherlands Holds Strong as a Premier Food Distribution Hub
    With a net export value of $30 billion, the Netherlands remains a central player in dispatching food products across continents. Despite its smaller landmass, Dutch expertise in food processing, logistics, and cold storage facilities makes it a crucial link in the global food supply chain. Its advanced port infrastructure, including the port of Rotterdam, ensures efficient distribution from Europe to the rest of the world.

    3. Spain’s Rich Food Heritage Continues to Propel Its Exports
    Spain’s net food exports reached $26 billion this year, reflecting its strong agricultural traditions and diverse product range, from olive oil and wine to citrus fruits and seafood. Spain has capitalized on quality branding and sustainable agriculture to expand its market share, especially within European Union countries and emerging markets.

    4. Australia’s Expanding Market Share in Food Exports
    Standing at $25 billion, Australia maintains its position as a leading exporter of beef, wheat, and wine. Its vast arable lands and strict quality standards have earned it a reputation for premium food products. The country’s emphasis on sustainable farming practices has also bolstered its export profile amid growing global demand for eco-friendly products.

    5. Thailand Surges in Southeast Asian Food Exports
    Thailand’s net exports of $23 billion highlight its rise as a key player in tropical fruit, seafood, and rice markets. Its strategic geographic location and efficient supply chains have helped Thai exporters access diverse markets rapidly. The country’s focus on organic farming and value-added products continues to drive growth.

    6. Argentina’s Agriculture Powerhouse Status Maintains Its Edge
    With $22 billion in net exports, Argentina remains a vital exporter of soybeans, beef, and corn. Its fertile Pampas region remains critical for cereal production, and recent investments in biotechnology are helping boost yields and export capacity.

    7. New Zealand’s Niche in the Global Food Market
    Generating $21 billion in exports, New Zealand specializes in dairy products, meat, and wine. Its clean, sustainable image and focus on high-quality, organic foods have resonated with global consumers, strengthening its export footprint.

    8. Canada and Ukraine Tied as Major Grain Suppliers
    Both Canada and Ukraine, each with $17 billion in net exports, are essential grain suppliers to the world. Canada’s vast wheat fields and advanced farming methods, along with Ukraine’s fertile soil, position them as reliable exporters amid fluctuating global markets.

    9. Poland’s Growing Export Profile
    Poland has reached $16 billion in net food exports, emphasizing its increasing role within the European Union in supplying processed foods, dairy, and grains. Its strategic investments in food safety and quality control have opened new market opportunities.

    10. Indonesia and Mexico Accelerate Food Export Growth
    Indonesia’s food exports are valued at $15 billion, with a focus on tropical fruits, seafood, and spices. Meanwhile, Mexico exports $12 billion worth of food, including avocados, berries, and processed foods, benefiting from trade agreements and rising consumer demand in North America.

    11. Italy, Turkey, and France Maintain Their Culinary Footprints
    Italy ($11 billion), Turkey ($11 billion), and France ($10 billion) continue to leverage their rich culinary traditions to boost exports. Italy is renowned for pasta and olive oil; Turkey’s strategic location facilitates exports of dried fruits and textiles; France remains unmatched in wine and specialty foods.

    A Diverging but Dynamic Food Export Landscape
    This year’s data demonstrates the diverse strengths countries leverage in their food export strategies. From Brazil’s comprehensive agricultural sector to the Netherlands’ logistical expertise, the global food trade continues to evolve, driven by technology, sustainability, and changing consumer preferences.

    Source: Post-analysis of FAO data, 2025

  • Top Countries with the Most Satellites in Orbit

    Top Countries with the Most Satellites in Orbit

    Breaking Down the Global Satellite Count in 2025

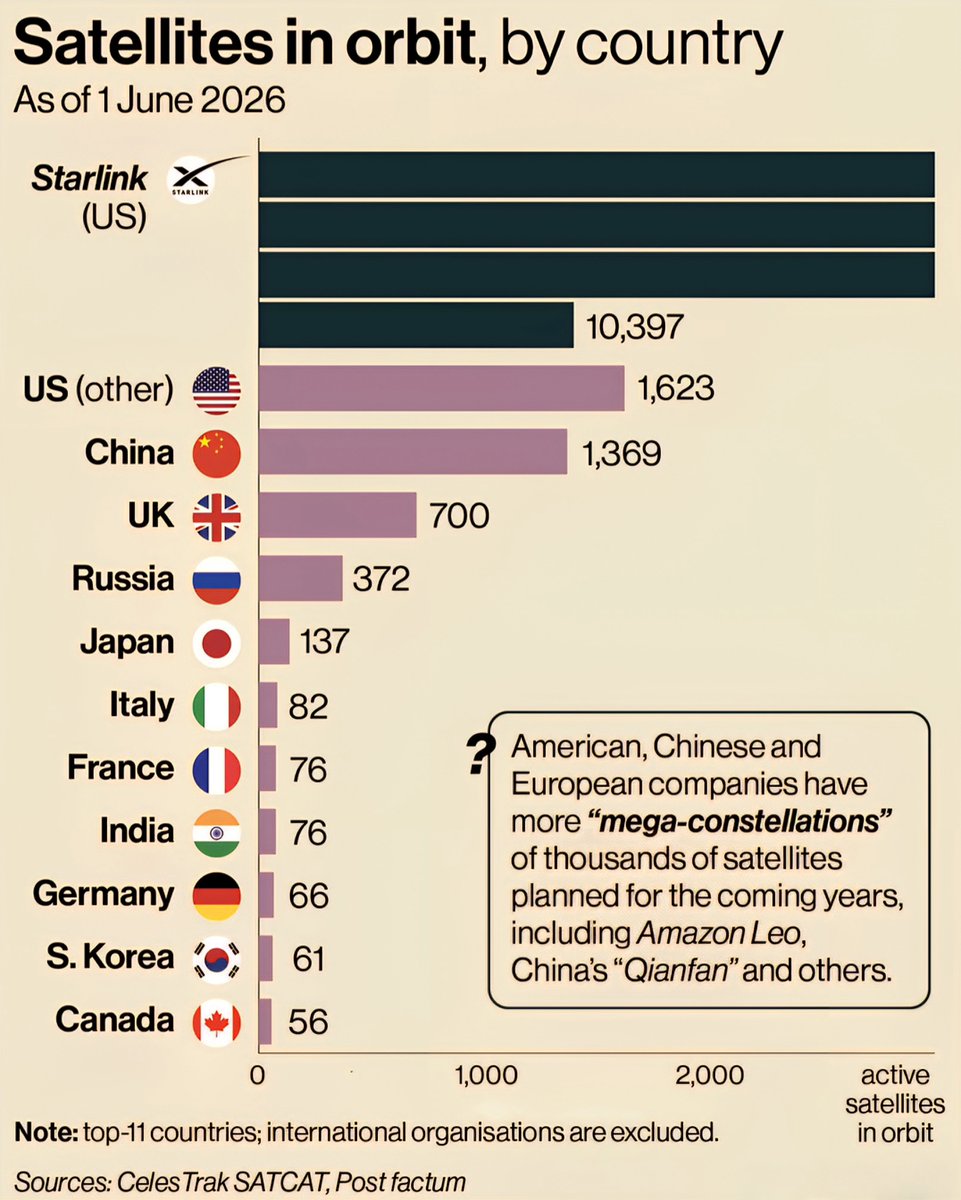
    The world of space technology continues to evolve rapidly, with an increasing number of satellites orbiting Earth, powering everything from communications to navigation systems. As of 2025, here’s a detailed look at which countries stand out in satellite deployment, showcasing their advancements in space exploration and satellite services.


    The United States Leads with Over 12,000 Satellites

    The United States maintains a commanding presence in space, with its satellite count exceeding 12,000. This includes the dominant Starlink constellation, operated by SpaceX, which alone accounts for approximately 10,400 satellites designed to provide global internet coverage. Besides Starlink, the US operates approximately 1,600 other satellites dedicated to military, scientific, and commercial purposes.

    This extensive satellite network underscores the nation’s focus on maintaining technological supremacy, ensuring secure communications, weather monitoring, and national defense capabilities.


    China Continues Rapid Expansion, Crossing 1,300 Satellites

    China’s space agency has been aggressively increasing its satellite constellation, reaching around 1,370 satellites in orbit. The country has focused heavily on both military and commercial satellites, including the BeiDou navigation system, which rivals GPS.

    China’s rapid growth in satellite deployment reflects its strategic ambitions to become a leading space power, with significant investments in space technology for economic development, surveillance, and scientific research.


    The United Kingdom’s Growing Presence: 700 Satellites

    The UK has seen a substantial increase in satellite deployment, crossing the 700-mark. This rise is driven by initiatives targeting satellite communications, Earth observation, and the burgeoning space startup scene. The UK’s investment in space tech is aimed at boosting its capabilities in global broadband, data analytics, and maritime surveillance.

    British companies and agencies are steadily expanding their footprint, indicating a robust interest in commercial satellite services and space innovation.


    Russia Maintains Over 370 Satellites in Orbit

    Russia continues to sustain a significant satellite constellation, with over 370 satellites in orbit. Many of these are part of the GLONASS navigation system, similar to GPS, which supports military and civilian navigation. Russia also utilizes satellites for reconnaissance, communication, and space science.

    Despite facing international challenges, Russia’s sustained satellite presence underlines its ongoing commitment to maintaining strategic space assets.


    Japan and South Korea Boost Their Satellite Programs

    Japan hosts approximately 137 satellites, primarily for Earth observation, communications, and scientific research. Its space program emphasizes technological innovation, with satellites supporting disaster monitoring and environmental management.

    South Korea’s satellite fleet includes about 61 units focused on navigation, communication, and technological development. The country aims to enhance its space capabilities to support economic growth and national security.


    European Nations: France, Italy, and Germany

    • France has about 76 satellites in space, with substantial contributions to Earth observation through programs like the Sentinel satellites and further investments in space science.

    • Italy operates around 82 satellites, with a focus on telecommunication, Earth monitoring, and scientific missions.

    • Germany maintains 66 satellites, emphasizing climate monitoring, scientific research, and defense applications.

    These European nations continue to collaborate through the European Space Agency (ESA), jointly expanding their orbital assets and capabilities.


    Canada’s Niche in Space: 56 Satellites

    Canada’s satellite presence is modest but impactful, with 56 satellites mainly used for environmental monitoring, communication, and scientific exploration. The country’s unique contribution involves polar orbit missions, supporting Arctic research and climate change studies.


    The Satellite Race in Numbers

    Total Satellite Count as of June 1, 2026, based on CelesTrak SATCAT data

    Country/Region Number of Satellites
    United States (Starlink & Others) 12,020+
    China 1,370
    United Kingdom 700
    Russia 372
    Japan 137
    Italy 82
    France 76
    India 76
    Germany 66
    South Korea 61
    Canada 56

    This snapshot exemplifies the rapid expansion of satellite networks globally, driven by technological innovation, economic ambitions, and strategic imperatives.


    As space continues to become a pivotal frontier for technological and geopolitical endeavors, countries keep pushing their satellite capabilities to secure a competitive edge. With space technology advancing at a breathtaking pace, the figure of over 12,000 operational satellites marks only the beginning of an era where orbital domains are increasingly central to daily life on Earth.

    Source: CelesTrak SATCAT, as of June 1, 2026.

  • Top Countries Where Christianity is Most Practiced in the World

    Top Countries Where Christianity is Most Practiced in the World

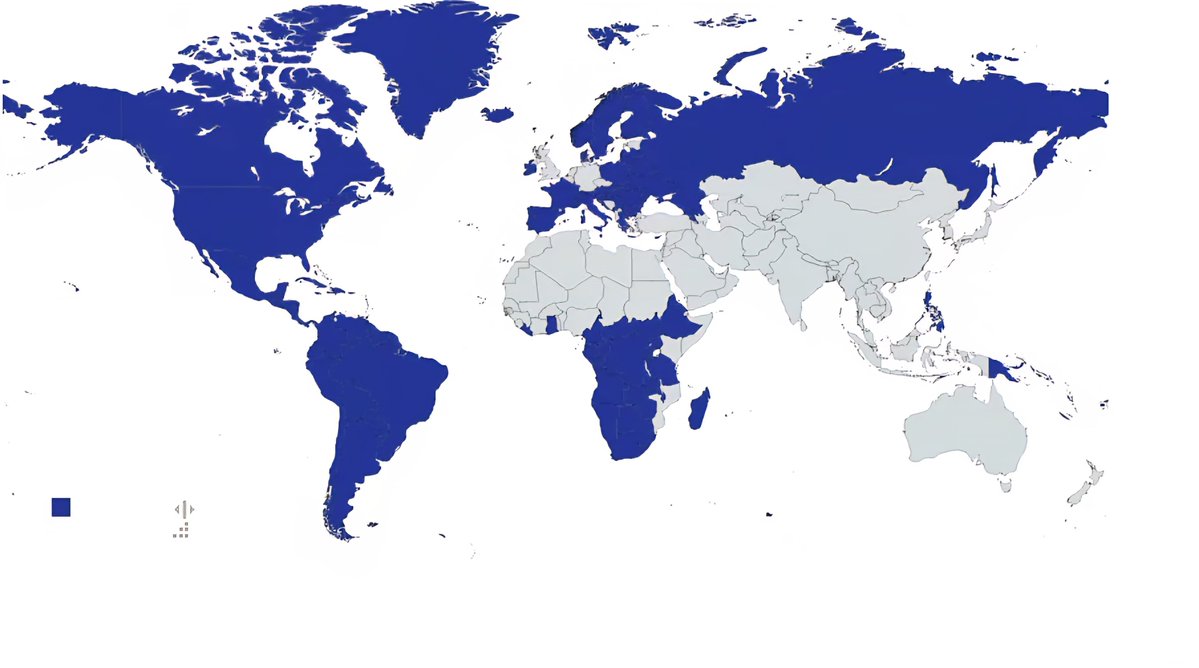
    Countries Where Christianity is Practiced by Over 50% of the Population

    1. The United States: A Predominant Christian Nation

    The United States remains one of the most prominent countries with Christianity practiced by over half its population. With diverse denominations including Protestantism, Catholicism, and other Christian groups, the U.S. continues to see a significant influence of Christian beliefs on its culture, politics, and social systems. According to recent surveys in 2025, approximately 70% of Americans identify as Christian, making it a defining feature of the nation’s religious landscape.

    2. Brazil: The Largest Christian Population in South America

    Brazil holds the title for the largest Christian population in South America, with more than 80% of its citizens adhering to Christian faiths. The country’s religious composition is predominantly Roman Catholic, but Protestant denominations, especially Pentecostal and Evangelical churches, have seen rapid growth over recent decades. Christianity deeply influences Brazil’s festivals, holidays, and national identity.

    3. Mexico: Heartland of Christianity in North America

    With over 90% of its population identifying as Christian, predominantly Catholic, Mexico remains one of the most Christian countries in North America. Religious practices permeate daily life, from celebrations like Día de los Muertos to traditional church services. Catholicism’s role is central to Mexican cultural and social structures, with the church actively involved in community life and festivities.

    4. Nigeria: Africa’s Religious Powerhouse

    In Nigeria, Christianity is practiced by more than 50% of the population, especially in the southern regions. The country exhibits a vibrant, dynamic Christian community comprising various Protestant denominations and a significant number of Catholics. Christianity plays a crucial role in Nigerian politics, education, and social services, contributing to the country’s complex religious landscape.

    5. Russia: The Resurgence of Russian Orthodoxy

    Russia continues to have a strong Christian presence, with the Russian Orthodox Church being the dominant faith. With nearly 70% of Russians identifying as Christian, primarily Orthodox, the church has regained influence following decades of suppression during the Soviet era. Religious festivals, church attendance, and Orthodox traditions are widely observed and are integral to Russia’s cultural identity.

    6. The Philippines: A Predominantly Catholic Country

    The Philippines remains the only Asian country where Christianity, mainly Catholicism, is practiced by over 80% of the population. Spanish colonial influence contributed to the widespread adoption of Catholic traditions, which continue to shape Filipino society. Major events like the Sinulog Festival and Black Nazarene processions exemplify Filipino devotion and cultural identity tied to Christianity.

    7. Poland: The Bastion of Catholic Faith in Europe

    Poland is known for its deeply rooted Catholic tradition, with approximately 85% of its population adhering to the faith. The Catholic Church plays a vital role not just spiritually but also politically and culturally. Major holidays like Christmas and Easter are celebrated with fervor, and Pope John Paul II remains a revered national figure.

    8. Ethiopia: The Land of Christian Diversity

    Ethiopia boasts an ancient Christian heritage, with over 60% of its population following Christianity, notably the Ethiopian Orthodox Tewahedo Church. Its unique traditions, including elaborate religious festivals and distinctive liturgical practices, are vital to Ethiopian national identity. Christianity has persisted here for centuries, shaping the country’s history and culture.

    9. Kenya: A Growing Christian Majority

    In Kenya, more than 80% of the population identifies as Christian, with a mixture of Protestant, Catholic, and indigenous Christian groups. The church plays a vital role in community development, education, and health services across the nation. Religious festivals often blend indigenous customs with Christian traditions, creating vibrant cultural expressions.

    10. Argentina: A South American Christian Stronghold

    Argentina remains one of South America’s leading countries practicing Christianity predominantly Catholicism, with about 80% of its residents adhering to the faith. The influence of the Catholic Church is evident in the country’s traditions, politics, and daily practices. Religious holidays, such as Semana Santa, are celebrated with enthusiasm.


    Map of every country in the world where Christianity is practiced by more than 50% of the population


    The global landscape of Christianity in 2025 demonstrates significant demographic shifts and cultural influences. From Latin America to Africa and North America, Christianity continues to be a powerful force in shaping societal values, traditions, and national identities across the world.

  • Top African Countries with Higher GDP Per Capita Than China in 1980

    Top African Countries with Higher GDP Per Capita Than China in 1980

    Discovering Africa’s Economic Shift: A 2025 Perspective

    Economic Shift in Africa

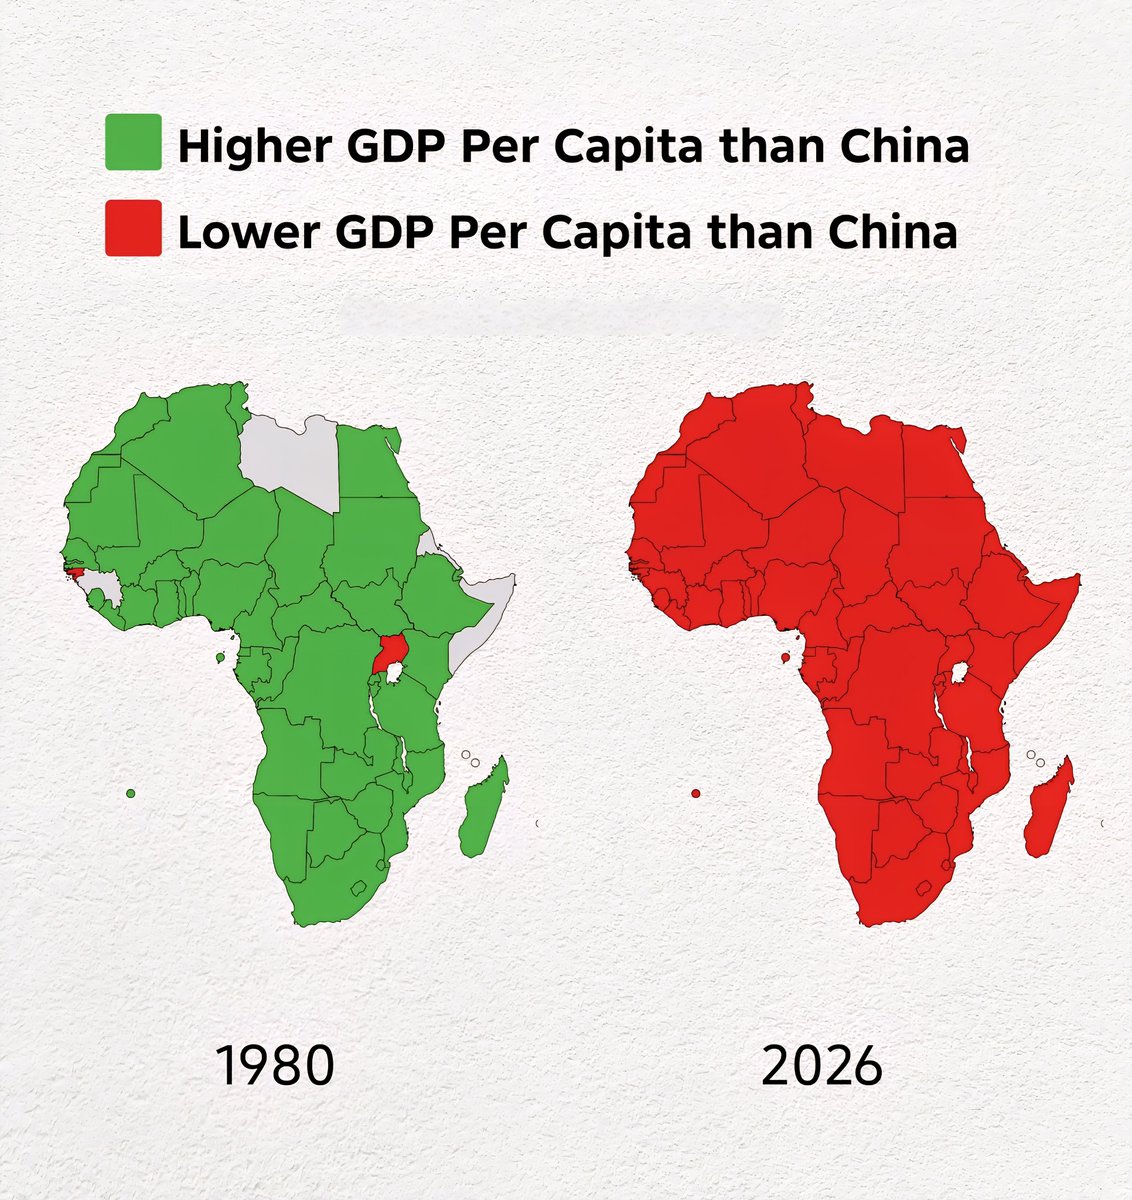
    In the landscape of global economies, historical trends often tell compelling stories about growth, stagnation, and change. One striking revelation as of 2025 is that, back in 1980, many African countries boasted higher GDP per capita figures than China—a situation that has since undergone significant transformation. This list provides a detailed look into the economic shifts between Africa and China over the past four and a half decades, emphasizing the nations that led the way initially, and how the tables have turned or remained static.

    Countries That Boasted Higher GDP Per Capita than China in 1980

    1. Nigeria
    In the early 1980s, Nigeria’s economy was fueled by its rich oil reserves, positioning it among Africa’s top economic performers per capita. The nation’s resource wealth translated into relatively higher living standards at the time. However, subsequent economic downturns, political turmoil, and infrastructural challenges have since impacted these figures significantly.

    2. South Africa
    South Africa stood out in 1980 with its diversified economy, advanced industrial base, and relatively high GDP per capita among African nations. Despite facing apartheid-era sanctions and internal conflicts later on, the country maintained a strong economic position into the 2000s. Its economy has experienced fluctuations but remains influential on the continent.

    3. Libya
    Oil wealth positioned Libya as a leading African economy in 1980, with a high GDP per capita. Political upheavals and civil unrest, especially after 2011, have dramatically affected its economic stability and per capita income levels, which are now significantly below China’s.

    4. Egypt
    Egypt’s strategic location, diverse economy, and sizeable population helped it sustain a relatively high GDP per capita. Over the years, reform efforts and infrastructural investments have aimed to boost growth, but challenges persist.

    5. Algeria
    As an oil and gas powerhouse, Algeria’s 1980 economy was considerably robust, placing it higher than China in per capita terms. Declining oil prices and political shifts have impacted its economic standing over the decades.


    Countries That Had Lower GDP Per Capita than China in 1980

    1. Kenya
    In 1980, Kenya’s economy was primarily agricultural, with lower per capita income compared to China’s rapid expansion during that period. Growth has been steady but gradual, and the gap persists today.

    2. Ethiopia
    Despite its large population, Ethiopia was one of Africa’s poorest nations in 1980. Recent decades have seen remarkable growth, yet its GDP per capita still lags behind China’s explosive rise.

    3. Democratic Republic of Congo
    Historical instability and resource challenges kept the DRC’s per capita income low in 1980. Although recent years have seen infrastructural development, incomes remain below China’s levels.

    4. Tanzania
    Predominantly agricultural, Tanzania’s economic indicators in 1980 were modest compared to China’s. Efforts toward modernization and tourism have fueled growth, but income levels remain relatively low.

    5. Angola
    In the early 1980s, Angola was emerging from independence conflicts, with a struggling economy. Oil production has since improved, but economic recovery remains underway, and per capita income stays below China’s.


    The Economic Trajectory: From 1980 to 2025

    The economic diverging paths observed over these decades are notable. China’s rapid industrialization, massive infrastructure investments, and integration into the global trade ecosystem catapulted its GDP per capita to new heights, surpassing many African nations. Meanwhile, some African countries experienced growth, but often at slower rates or facing setbacks due to political instability, resource dependency, or external shocks.

    Conversely, countries like Nigeria, South Africa, and Algeria transitioned from higher-than-China status to more moderate positions, underscoring the complex interplay of resource management, governance, and global market forces.

    Key Takeaways

    • Historical Benchmarks Matter: In 1980, several African nations led China in GDP per capita, highlighting their relative economic standing at the time.
    • Changing Dynamics: Over 45 years, China’s economic ascendancy has reshaped global rankings, emphasizing the importance of long-term growth strategies.
    • Persistent Challenges & Opportunities: African countries continue to grapple with development hurdles but also possess vast potential for future growth.

    The economic charts of 1980 serve as a reminder of how swiftly global fortunes can change. As of 2025, the economic story of Africa and China remains one of transformation, resilience, and ongoing opportunity.


    Note: Data visuals and detailed statistical comparisons are available through recent economic reports and global rankings for a comprehensive understanding of these shifts.

  • Top Least Religious Countries in the World

    Top Least Religious Countries in the World

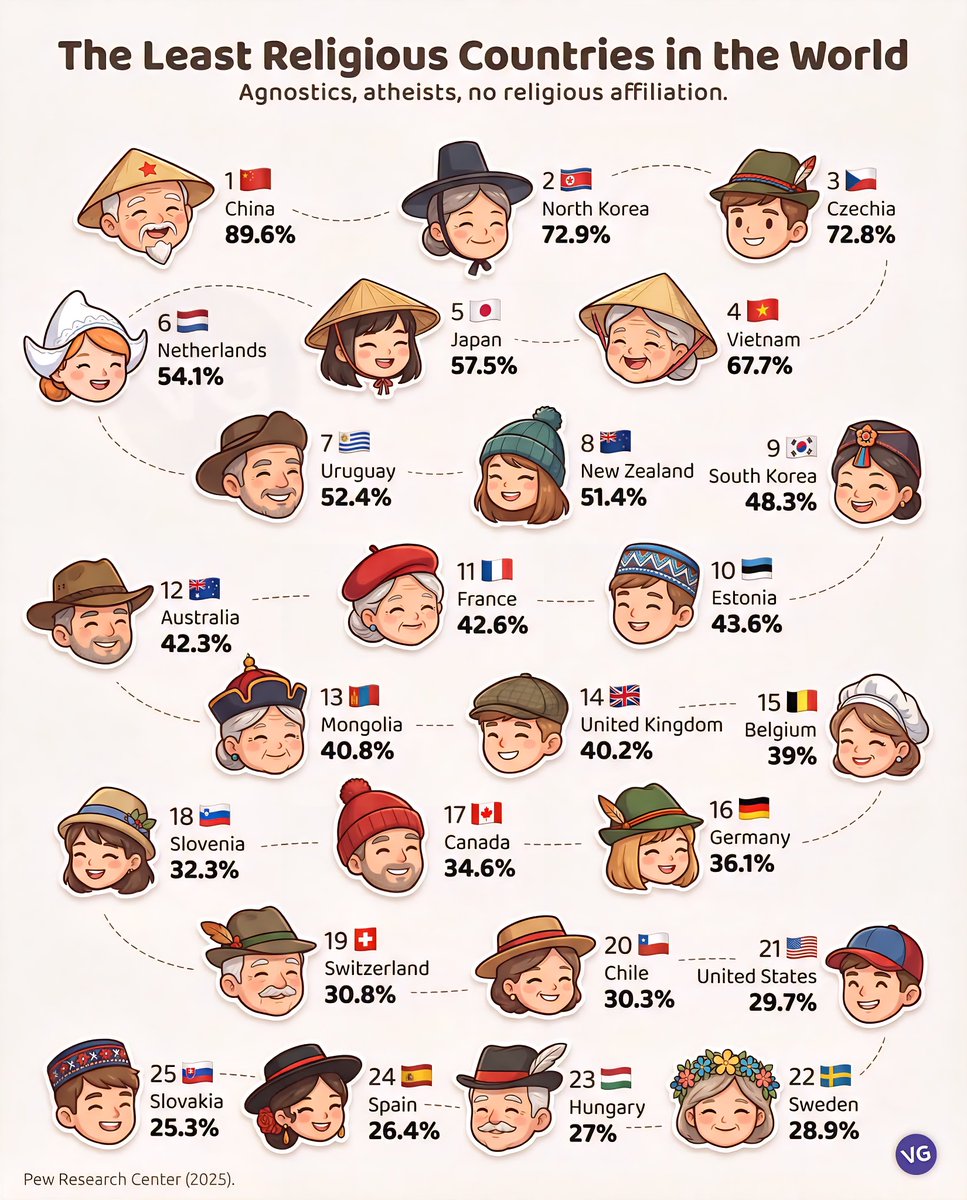
    Top 25 Countries with the Lowest Religious Affiliation in 2025

    • China Dominates as the Least Religious Country
      In 2025, China leads as the nation with the highest percentage of religious disaffiliation, with approximately 89.6% of its population identifying as atheist, agnostic, or non-religious. This staggering figure underscores the country’s unique cultural and political landscape, where religious practice has historically been suppressed or discouraged.

    • North Korea: A Highly Secular Society
      Following closely, North Korea exhibits a deeply secular society, with nearly 73% of its population reporting no religious affiliation. State ideology, combined with strict government control, influences the widespread non-religion prevalent in the country.

    • Czechia Continues Its Secular Trend
      Czechia, known for its rich history of religious upheaval, remains one of the least religious countries in 2025, with about 72.8% of residents reporting no religious belief. Its long-standing secular culture is reflected in the nation’s education and social norms.

    • Vietnam’s Increasing Dissociation from Religion
      Vietnam sees about 67.7% of its population identifying as non-religious—an increase influenced by modernization, government policies, and shifting cultural attitudes toward traditional faiths.

    • Japan’s Significant Secular Shift
      In Japan, 57.5% of people identify as non-religious, highlighting a cultural shift that emphasizes tradition over organized faith, with many viewing religion more as cultural practice than spiritual conviction.

    • European Countries Show Growing Secularism
      Countries like the Netherlands (54.1%), France (42.6%), and Germany (36.1%) exhibit significant portions of their populations with no religious affiliation, reflecting broad societal acceptance of secular lifestyles and skepticism toward organized religion.

    • South America’s Unexpected Trends
      Uruguay (52.4%) and Chile (30.3%) present interesting cases where increased secularism coincides with historical religious influences, illustrating ongoing cultural shifts.

    • Oceania’s Changing Religious Landscape
      New Zealand (51.4%) and Australia (42.3%) continue to embrace secular identities, influenced by diverse immigrant populations and emphasis on individualism over traditional religious adherence.

    • South Korea’s Evolving Religious Scene
      Nearly 48.3% of South Koreans identify as non-religious, reflecting cultural changes and declining influence of traditional faiths amid rapid modernization.

    • Estonia: Europe’s Least Religious Nation
      Estonia leads the way in Europe, with 43.6% of its population reporting no religious belief, emphasizing a highly secular society driven by progressive values.

    • North America’s Shift Towards Secularism
      The United States, with 29.7%, and Canada (34.6%), have seen notable increases in secular identities, driven by generational change and societal debates over religious influence.

    • Eastern and Central Europe’s Mixed Trends
      Hungary (27%) and Slovakia (25.3%) showcase diverse religious landscapes, with substantial portions of populations moving away from traditional faiths.


    Understanding the Numbers
    These percentages, derived from Pew Research Center’s 2025 survey, reflect the proportion of people who identify as atheist, agnostic, or having no religious affiliation. The trend indicates a clear shift towards secularism across many parts of the world, influenced by cultural evolution, government policies, globalization, and generational change.


    The Future of Religion in Global Societies
    As secularism continues to grow, discussions around societal values, community cohesion, and the role of faith in public life are more relevant than ever. Countries once deeply rooted in religious traditions are experiencing transformation, reshaping cultural identities and influencing global trends.


    Note: The percentages illustrated are based on the most recent data available from Pew Research Center, 2025.

  • Top Fertility Rates in the Americas in 1960

    Top Fertility Rates in the Americas in 1960

    Decline in Fertility Rates in the Americas: A 2025 Overview

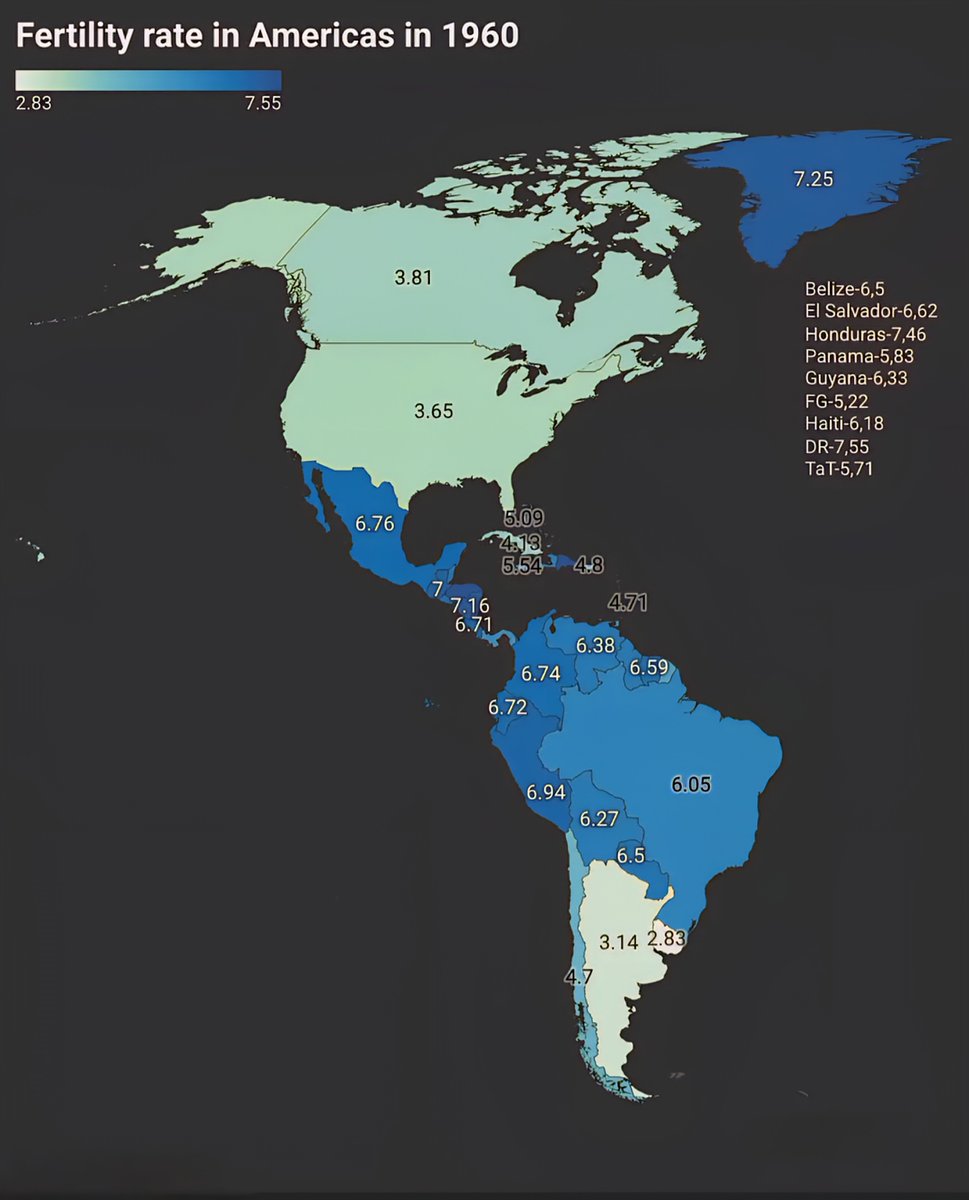
    Fertility Rate in Americas in 1960

    1. Significant Drop from the 1960s to 2025

    The fertility rate across countries in the Americas has experienced a dramatic shift over the past six decades. In 1960, the fertility rate was notably higher, often exceeding five children per woman in many nations. Today, this figure has plummeted, reflecting changing societal norms, increased access to education, and advancements in healthcare. The current average fertility rate for the continent hovers around 1.7 children per woman, aligning with current global trends toward lower birth rates.

    2. Societal and Economic Influences on Fertility Trends

    Various factors have contributed to this decline. Economic development has spurred urbanization, leading to lifestyle changes that favor smaller families. The rise of women’s participation in the workforce has directly impacted fertility, with many opting to delay motherhood in pursuit of career goals. Additionally, increased access to contraception and reproductive health services has empowered women to make more informed choices about family planning.

    3. Impact on Population Growth and Demographics

    While overall population numbers continue to rise, albeit at a slower pace, countries in the Americas are witnessing shifts in demographic age profiles. With lower fertility rates, many nations are experiencing aging populations, which pose challenges for healthcare systems, pension schemes, and workforce sustainability. Countries such as Canada and the United States have already encountered these issues, prompting policymakers to adjust social programs accordingly.

    4. Variations Between Countries

    The fertility decline isn’t uniform across the continent. For example, countries like the United States and Canada have maintained relatively stable fertility rates, close to replacement levels. In contrast, nations like Mexico and Brazil have seen more pronounced drops, frequently below the replacement threshold of 2.1 children per woman. Some Caribbean nations exhibit differing patterns, often influenced by cultural practices and access to reproductive health services.

    5. Consequences for Future Generations

    One of the major implications of declining fertility rates is the potential for shrinking future populations if current trends persist. This can affect economic growth, innovation, and social dynamics. Governments in the Americas are considering policies such as parental support initiatives, incentives for larger families, and investments in child-friendly services to mitigate these effects.

    6. Policy Responses and Challenges

    Many countries are actively implementing measures to address the demographic shifts caused by low fertility rates. These include expanding parental leave, subsidizing childcare, and creating more family-friendly workplaces. However, balancing these policies with economic realities often presents challenges, especially in nations where budget constraints limit social spending.

    7. The Role of Education and Cultural Change

    Education, particularly among women, remains a pivotal factor in fertility decisions. The trend toward higher education levels correlates with delayed childbirth and smaller family sizes. Cultural shifts, including changing perceptions of gender roles and family structures, continue to influence fertility patterns across the continent.

    8. Future Outlook

    Looking ahead to 2025 and beyond, experts anticipate fertility rates in the Americas will stabilize at low levels unless socioeconomic conditions change significantly. Migration flows may also impact population dynamics, either alleviating or exacerbating demographic challenges. Countries will need innovative policies and international cooperation to address the evolving landscape of fertility and population growth.


    This comprehensive overview highlights the complex factors influencing fertility rates in the Americas, emphasizing the importance of adaptive policies and societal changes to navigate demographic futures.

  • Who Controlled the U.S. House Throughout the 1930s

    Who Controlled the U.S. House Throughout the 1930s

    The Shift in Control of the U.S. House Over the Past Century

    Democrats Handedly Dominated the House from 1931 to 1994

    For more than six decades, the Democratic Party reigned supreme in the U.S. House of Representatives, from 1931 through 1994. Starting in the early 1930s, amidst the Great Depression, Democrats held control consistently, shaping pivotal New Deal policies and steering the nation during World War II. This era marked a significant period where Democratic influence dictated legislative agendas, with only brief moments hinting at Republican gains. Notable years during this stretch include:

    • 1931–1946: Overwhelming Democratic control, shaping New Deal and wartime legislation.
    • 1947: A rare split year with Republicans taking control briefly.
    • 1948–1994: Democratic dominance, with control solidifying through the post-war years and into the late 20th century.

    U.S. Capitol building with Congress in session

    A Short-lived Republican Surge in the Late 1940s

    While Democrats largely maintained control throughout the mid-20th century, there were notable moments when Republicans briefly took the helm. In 1947, Republicans seized control, but this shift was fleeting, as Democrats regained it the next year, from 1948 through 1954. This period saw growing partisan battles during the early Cold War era, with Republicans making periodic advances.

    The Resurgence of Republican Power in the Mid-1950s

    The mid-1950s marked the beginning of a new era of Republican resurgence at the House level. After losing dominance earlier, Republicans gained control again in 1953 and held onto it through 1956. The 1950s were characterized by increased bipartisan tensions, with the GOP pushing back against Democratic New Deal legacies, leading to shifts in legislative priorities.

    Democratic Dominance Continues into the 1960s and Early 1970s

    The Democratic hold remained robust through the 1960s and into the early 1970s, aligning with the tumultuous social reforms, civil rights movement, and Vietnam War era. Control persisted through multiple election cycles, signifying the party’s influence over major legislative initiatives.

    The Republican Comeback in the Late 1990s and Early 2000s

    The late 20th century marked a swing back to Republican control. Starting in 1995, Republicans held the House for over a decade. This period included the Republican Revolution of 1994, led by Newt Gingrich, which dramatically shifted power, followed by consistent control into the early 2000s. The years 1995-2006 marked one of the longest stretches of GOP control in recent history, influencing national policy heavily.

    Democrats Secure the House Throughout the 2000s and 2010s

    The 2008 election catalyzed a shift back to Democratic control, which persisted through the 2010s, including significant legislative achievements under President Barack Obama. The Democrats’ leadership during this period focused on health care reform, economic recovery, and social justice initiatives.

    Republicans Reclaim Control in 2023 and Maintain It Through 2026

    The most recent elections saw Republicans regaining control of the House in 2023. This shift signals a continued trend of conservative influence shaping U.S. legislation under the current political landscape. As of 2026, Republicans remain in control, influencing policies on immigration, economic reform, and national security.


    Final Takeaway

    The control of the U.S. House of Representatives over the past century reflects broader political, social, and economic shifts in the nation. From the Democratic dominance of the early 20th century to the recent Republican resurgence, these changes underscore the evolving landscape of American politics. Voters’ preferences, national crises, and leadership styles continue to influence which party holds sway in Congress. The upcoming 2026 elections will be crucial in determining whether this trend persists or if a new chapter of control will emerge.

    Stay tuned for more updates on political power shifts and how they shape America’s future!

  • Top 20 Most Popular Sports Worldwide by Fan Count

    Top 20 Most Popular Sports Worldwide by Fan Count

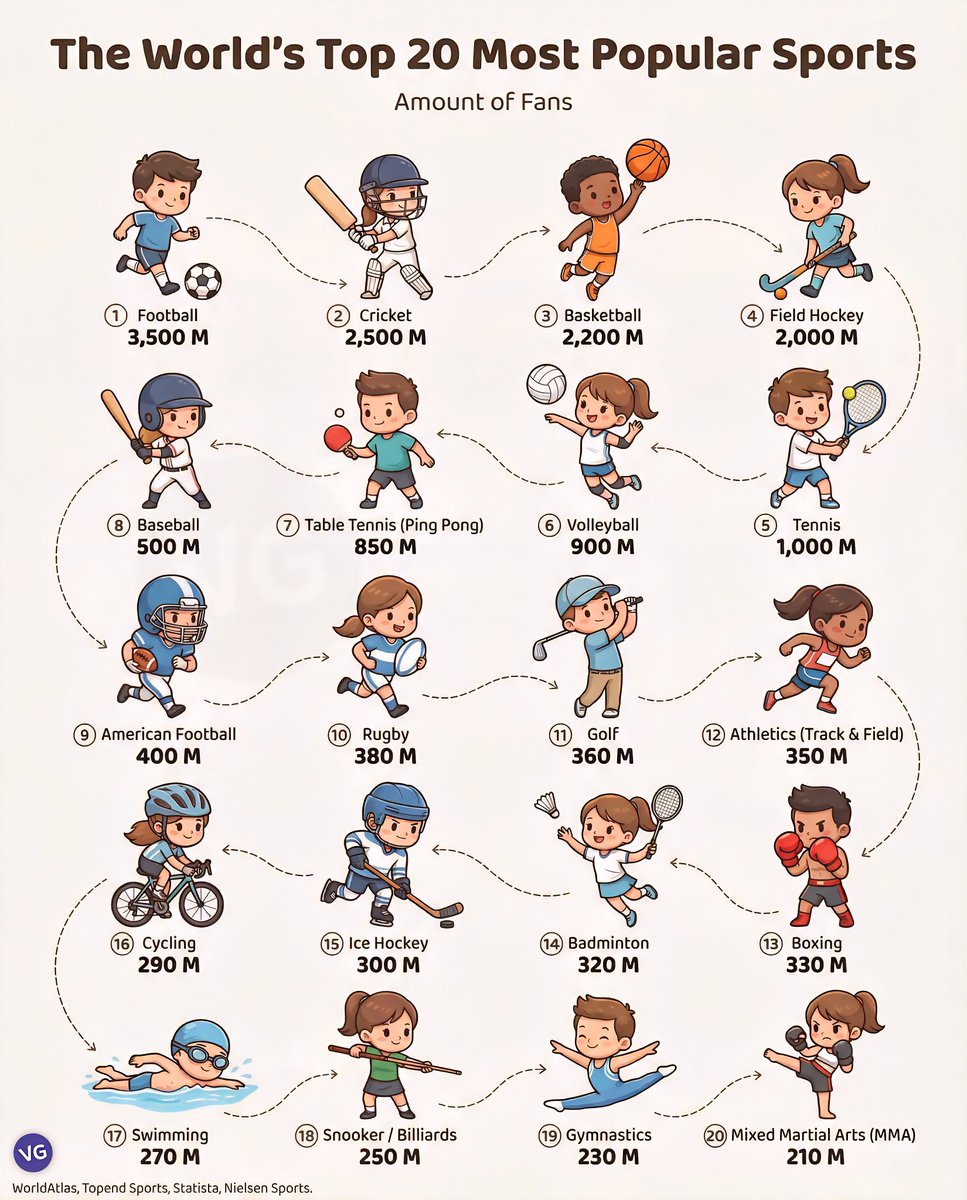
    Top 20 Most Popular Sports in the World by Fan Base in 2025

    1. Football – Over 3.5 Billion Fans

    Football, known as soccer in the United States, continues to dominate the global sports scene in 2025. With an estimated 3.5 billion fans worldwide, the sport’s worldwide appeal is unrivaled. Major tournaments like the FIFA World Cup and UEFA Champions League attract billions of viewers annually, fueling its growth. Its simplicity, accessibility, and rich history make football a favorite across different continents, from the beaches of Brazil to the pitches of Europe and Africa.

    2. Cricket – Around 2.5 Billion Enthusiasts

    Cricket maintains its position as the second most popular sport globally, with an estimated 2.5 billion fans. Countries like India, Pakistan, Indonesia, and Australia lead the charge, where the sport is woven into the cultural fabric. The ICC Cricket World Cup and Indian Premier League (IPL) continue to attract massive viewership, boosting the sport’s popularity. Innovations such as T20 cricket have contributed to its increased appeal among younger audiences.

    3. Basketball – 2.2 Billion Followers

    Basketball, fueled by the popularity of the NBA, has gained millions of fans around the world, totaling approximately 2.2 billion. Major basketball events like the Olympics and World Cup tournaments help maintain global interest. With the rise of international players in the NBA and the growth of grassroots programs in Asia and Africa, basketball’s reach is expanding exponentially.

    4. Field Hockey – 2.0 Billion Admirers

    Field hockey remains a top sport with an estimated 2 billion fans. It is especially popular in countries like India, Australia, and the Netherlands. The Hockey World Cup and Olympic competitions continue to draw significant viewership. Its fast-paced gameplay and strategic depth make it a favorite both for players and spectators alike.

    5. Tennis – 1 Billion Spectators

    Tennis has held steady at around 1 billion fans in 2025. Grand slam tournaments such as Wimbledon, the U.S. Open, and the French Open remain some of the most-watched sporting events worldwide. With stars like Novak Djokovic and Iga Swiatek continuing to dominate headlines, tennis attracts a broad and diverse fan base.

    6. Volleyball – 900 Million Fans

    Volleyball maintains its popularity with approximately 900 million fans globally. The sport’s indoor and beach variants appeal to a wide demographic. The FIVB Volleyball World Championship and Olympic volleyball matches are key events that keep the sport on millions of screens worldwide.

    7. Table Tennis – 850 Million Fans

    Table tennis, often called ping pong, still draws around 850 million enthusiasts. Its rapid gameplay and small equipment requirements make it especially popular in China, Europe, and Southeast Asia. International competitions like the World Table Tennis Championships enhance its visibility and appeal.

    8. Baseball – 500 Million Fans

    Baseball’s dominant presence is concentrated in North America, Latin America, and East Asia. With an estimated 500 million fans, major leagues such as MLB continue to draw substantial viewership. Legendary players and iconic events like the World Series keep the sport vibrant and relevant.

    9. American Football – 400 Million Fans

    In the United States and increasingly around the world, American football has an estimated 400 million fans. The NFL’s Super Bowl remains one of the most-watched sporting events annually. The sport’s strategic complexity and impressive athleticism attract fans from diverse backgrounds.

    10. Rugby – 380 Million Supporters

    Rugby, including its league variants, boasts around 380 million fans. Major tournaments like the Rugby World Cup and Six Nations Championship resonate globally, especially in countries like New Zealand, England, and South Africa. The sport’s values of teamwork and physical endurance appeal across cultures.

    11. Golf – 360 Million Players and Fans

    Golf maintains a steady following with approximately 360 million enthusiasts. Iconic tournaments such as The Masters and the Open Championship continue to attract substantial audiences. The sport’s blend of precision, patience, and scenic venues sustain its widespread appeal.

    12. Athletics (Track & Field) – 350 Million Enthusiasts

    Track and field disciplines attract around 350 million fans globally. The Olympics serve as the pinnacle event for athletics, showcasing record-breaking performances from athletes like Karsten Warholm and Shelly-Ann Fraser-Pryce. The sport’s accessibility and diversity contribute to its enduring popularity.

    13. Boxing – 330 Million Followers

    Boxing remains a significant combat sport with an estimated 330 million fans. High-profile bouts, including heavyweight title fights and crossover events, draw global attention. Emerging stars and historic rivalries help sustain interest among younger demographics.

    14. Badminton – 320 Million Fans

    Especially popular in Asia, badminton has around 320 million supporters. The sport’s fast-paced gameplay and Olympic presence make it a prominent fixture in countries like China, Indonesia, and Denmark. International championships attract viewers from around the world.

    15. Ice Hockey – 300 Million Fans

    Ice hockey appeals to approximately 300 million fans, primarily in Canada, Russia, and parts of Northern Europe. The NHL playoffs and Winter Olympics are pivotal events that bolster its global audience. The sport’s high-speed action continues to captivate fans.

    16. Cycling – 290 Million Enthusiasts

    Cycling, with about 290 million followers, is both a competitive sport and a popular recreational activity. Events like the Tour de France highlight the sport’s endurance and complexity, drawing a dedicated global audience that admires athletic perseverance.

    17. Swimming – 270 Million Fans

    With around 270 million fans, swimming benefits from its Olympic prominence and accessibility. Iconic athletes like Katie Ledecky and Caeleb Dressel have inspired many to take up the sport, making it both competitive and recreational.

    18. Snooker and Billiards – 250 Million Fans

    Snooker and billiards enjoy a solid following of about 250 million people. Key tournaments like the World Snooker Championship draw viewers due to the sport’s skillful gameplay and strategic depth. Its popularity is especially strong in the UK and East Asia.

    19. Gymnastics – 230 Million Followers

    Gymnastics boasts a global fan base of roughly 230 million. The sport’s visually stunning routines and the Olympic spotlight shine a light on rising stars and established champions, fostering widespread admiration for their agility and artistry.

    20. Mixed Martial Arts (MMA) – 210 Million Fans

    MMA, including organizations like UFC, continues its upward trajectory with approximately 210 million fans. The sport’s intense fights, charismatic fighters like Amanda Nunes and Israel Adesanya, and pay-per-view events have propelled MMA into mainstream consciousness.


    Sources: WorldAtlas, Topend Sports, Statista, Nielsen Sports.

  • Top Countries with the Longest Maternity Leave

    Top Countries with the Longest Maternity Leave

    Comparing Maternity Leave Across Countries

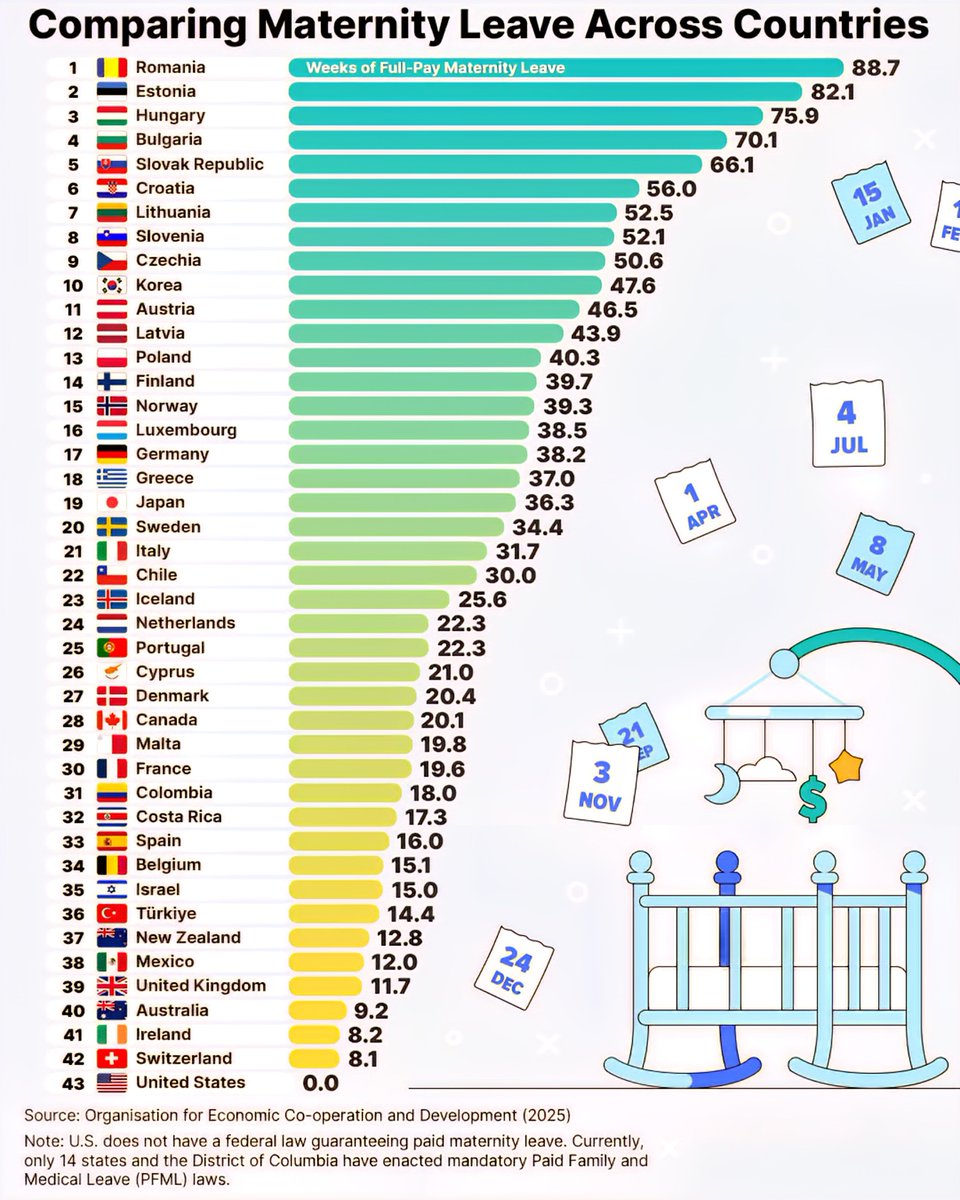
    Top Countries Offering the Longest Maternity Leave in 2025

    Romania Leads with an Astonishing 88.7 Weeks of Paid Maternity Leave

    Romania has once again cemented its place at the top of the maternity leave chart, offering an incredible 88.7 weeks of paid leave for new mothers. This extensive period ensures mothers have ample time to recover, bond with their newborns, and establish a strong foundation for early childhood development. Such generous leave policies underscore Romania’s commitment to family welfare and maternal health, setting a global benchmark.

    Estonia and Hungary Continue to Prioritize Family Support

    Estonia, providing 82.1 weeks of paid leave, and Hungary with 75.9 weeks, follow closely behind Romania. These countries emphasize supporting mothers during the crucial postpartum period, which is vital for both mother and child’s well-being. Estonia’s progressive policies reflect its recognition of family health as a national priority, while Hungary’s longstanding tradition of family support remains evident in its generous leave policies.

    The Balkan States Exhibit Strong Maternity Leave Policies

    Bulgaria (70.1 weeks), Slovakia (66.1 weeks), and Croatia (56 weeks) showcase their dedication to family-friendly policies. Notably, Bulgaria has one of the longest paid maternity leave periods in Europe, emphasizing how Balkan nations value the health and stability of mothers and infants. These policies also help reduce gender inequality by supporting women’s re-entry into the workforce post-childbirth.

    Baltic Countries Maintain High Standards of Support

    Lithuania and Slovenia provide 52.5 and 52.1 weeks, respectively. Latvia (43.9 weeks) and Poland (40.3 weeks) also offer substantial paid leave. These nations’ comprehensive policies reflect their societal emphasis on family welfare, and many have robust social safety nets that help working mothers balance career and family life.

    Asian and European Leaders in Maternity Leave

    South Korea offers 47.6 weeks, often noted for its evolving family policies, though it remains below some European leaders. Austria follows with 46.5 weeks, demonstrating Europe’s commitment. Countries like Finland (39.7 weeks), Norway (39.3 weeks), and Germany (38.2 weeks) also maintain strong national standards that prioritize maternal health and child development.

    The Mediterranean and Nordic Countries Maintain Generous Policies

    Greece (37 weeks), Italy (31.7 weeks), and Iceland (25.6 weeks) show diverse approaches but share a focus on maternal and early childhood support. Nordic countries such as Sweden (34.4 weeks), Denmark (20.4 weeks), and Finland emphasize a balanced approach to maternity leave—combining duration with quality of life for mothers.

    Lower Ends of the Spectrum: Countries with Minimal Paid Leave

    In stark contrast, several nations, including Portugal (22.3 weeks), Cyprus (21 weeks), and Denmark (20.4 weeks), offer moderate paid maternity leave. Notably, Canada’s leave stands at approximately 20.1 weeks, while even in developed countries like the UK (11.7 weeks) and Australia (9.2 weeks), paid leave durations are comparatively shorter.

    The United States Stands Apart with No Federal Paid Maternity Leave

    The United States remains unique among developed nations, with no federal law mandating paid maternity leave. Some states and districts have enacted their own Paid Family and Medical Leave policies, but overall, new mothers often rely on employer-provided benefits or unpaid leave. This discrepancy highlights ongoing debates around family support policies in the U.S., with many advocating for nationwide reforms.


    Summary and Global Trends

    The data underscores a clear global trend: European and some Asian countries prioritize extensive paid maternity leave, recognizing its importance for societal health, gender equality, and economic stability. Conversely, countries with shorter or no mandated paid leave often face challenges in supporting working mothers and reducing gender disparities.

    As countries continue to develop policies aligned with work-life balance and family well-being, it remains to be seen whether others, especially larger economies like the United States, will adapt their legislation to better support mothers in the future.

    Source: Organisation for Economic Co-operation and Development (OECD), 2025.

  • What $100 Buys in 138 Countries After Exchange Rates

    What $100 Buys in 138 Countries After Exchange Rates

    • How Much $100 Can Get You Around the World in 2025

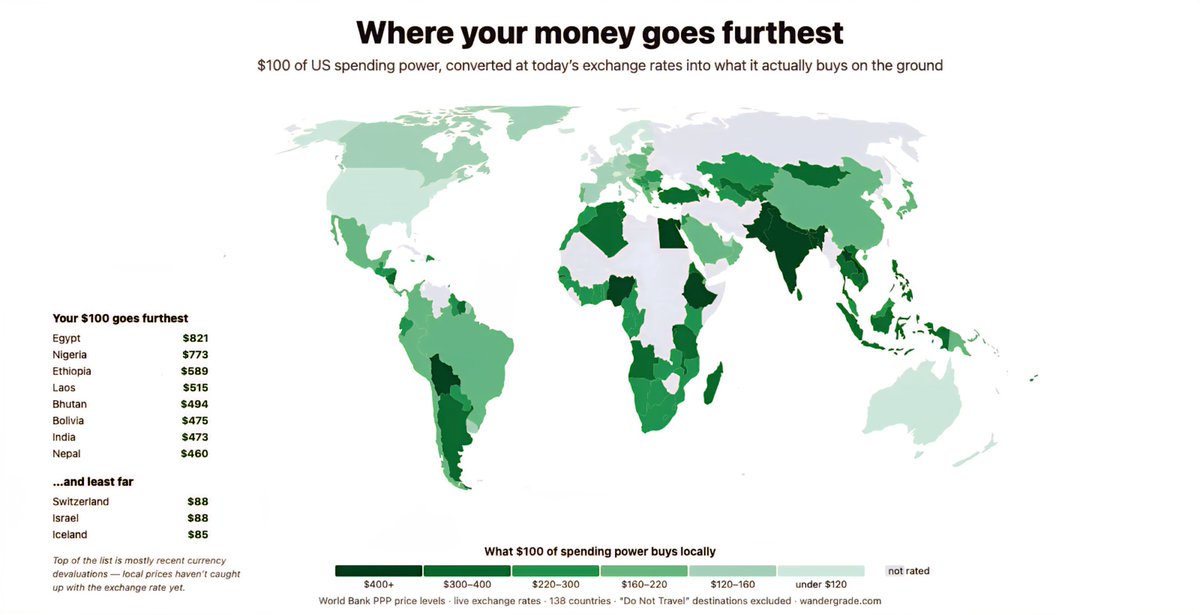
    Traveling with $100 in your pocket can mean vastly different things depending on where you go. Using current exchange rates and purchasing power parity (PPP) data from the World Bank’s latest 2024 report, we’ve mapped out exactly what that hundred bucks actually buys across 138 countries. Here’s a detailed look into what $100 is really worth in the global landscape today.


    1. Countries Where $100 Goes Further Than You Might Expect

    Certain nations boast incredibly low costs of living, making your dollar stretch much farther. Countries like Nigeria, Egypt, and Ethiopia top the list owing to recent currency devaluations, which inflate the amount of local currency you receive for each dollar. In these places:

    • Nigeria: You get roughly double the local goods and services for $100, thanks to a heavily devalued naira.
    • Egypt: The Egyptian pound’s recent fall means you’re effectively getting twice what it would normally buy pre-devaluation.
    • Ethiopia: Currency devaluations have similarly amplified your spending power, making local prices seem half of what they are in the United States.

    Note: These rankings are relatively unstable and may change as currencies fluctuate over the coming year.


    2. Top Nations with the Cheapest Real-World Prices for U.S. Visitors

    Looking beyond currency fluctuations, these countries naturally have lower living costs:

    • India: Your $100 could cover a luxurious day of activities, local meals, and even several nights in a budget hotel.
    • Vietnam: Known for affordable street food, transportation, and accommodations, Vietnam offers incredible value.
    • Pakistan: With its low prices in transportation, food, and entertainment, Pakistan makes your money go much further.

    In these nations, the local prices mean your $100 can do twice as much compared to spending it back home.


    3. Countries Where Your $100 Still Pack a Punch

    Some nations, though not as inexpensive as those above, still allow your money to buy a decent amount of goods and experiences:

    • Mexico: With the peso relatively stable, your dollar grants access to excellent food, local transportation, and sightseeing.
    • Turkey: Despite inflation, the Turkish lira still offers good value for tourists, especially outside of Istanbul.
    • Philippines: Your money stretches well, particularly in rural areas and on lesser-known islands.

    4. What Are the Countries Where $100 Has the Least Buying Power?

    At the upper end of the spectrum are places where prices are high—primarily due to stable or strong local currencies and high living costs:

    • Switzerland: The iconic country remains among the priciest, and your $100 will cover only a fraction of daily expenses.
    • Norway and Iceland: These Scandinavian countries’ high standards of living translate into steep prices, limiting what your dollar can buy.
    • Australia: Its strong currency and costly lifestyle mean less bang for your buck.

    Note: Because this data excludes countries under travel advisories, some high-cost nations with travel restrictions like Switzerland and Australia are not represented in the ranking.


    5. How Currency Fluctuations Impact Your Spending Power

    The recent currency devaluations in nations like Nigeria, Egypt, and Ethiopia have temporarily boosted local purchasing power. However, these figures are volatile and will likely change as currencies stabilize or further fluctuate in response to economic shifts.

    Caveat: It’s essential to consider not just exchange rates but also local price levels, inflation, and travel advisories when planning:

    • Countries with ongoing conflicts or severe sanctions often lack reliable PPP data and are excluded from the current analysis.
    • Countries with “Do Not Travel” advisories are filtered out for safety considerations but would otherwise add some intriguing insights.

    6. Global Map of Real-World Value of $100

    The accompanying map illustrates how far $100 stretches in different parts of the world. The darker the shade, the more local goods and services your dollar can purchase. Countries like Vietnam, India, and Nigeria shine bright in these maps, while Switzerland and Norway cast long shadows, indicating higher costs.


    7. What Does This Mean for Travelers and Budget Seekers?

    Understanding what your dollars are actually worth around the world can dramatically influence trip planning, budgeting, and even the choice of destination. This data reveals that, depending on where you go, your $100 can mean a luxurious weekend or a frugal adventure.

    Pro Tip: Always check current currency trends and local prices before traveling. Currency devaluations or economic shifts could dramatically alter these figures by the time you visit.


    Interested in the data or the code behind this map? The detailed scripts and intermediate datasets are available for sharing and remixing, perfect for travelers or analysts looking to dive deeper into global purchasing power trends in 2025.


    Remember, smart planning and understanding local costs can make all the difference in transforming your travel budget into unforgettable experiences.

  • Top 15 Best Asian Food Cities in the World 2026

    Top 15 Best Asian Food Cities in the World 2026

    Top 15 Asian Food Cities to Visit in 2025

    Asian Food Cities

    1. Mumbai, India: A Melting Pot of Flavors
      Mumbai stands out as a culinary hub blending traditional Indian cuisine with modern twists. Its vibrant street food scene offers everything from spicy vada pav to rich, creamy curries. The city’s diverse culinary landscape reflects its multicultural heritage, making it a must-visit for food enthusiasts eager to experience India’s rich flavors firsthand. Don’t miss tasting pav bhaji on the bustling Chowpatty Beach or indulging in authentic biryanis in local eateries.

    2. Osaka, Japan: Japan’s Gourmet Capital
      Known as Japan’s kitchen, Osaka boasts a thriving food scene centered around comfort foods like takoyaki (octopus balls) and okonomiyaki (savory pancakes). Its street food markets and bustling restaurants provide a tantalizing journey through Japanese cuisine. The city’s emphasis on fresh seafood and hearty street-side dishes makes it a favorite for food lovers seeking authentic Japanese flavors.

    3. Kyoto, Japan: Traditional Flavors and Elegant Dining
      Kyoto showcases refined Japanese cuisine, from kaiseki (multi-course meals) to matcha-flavored sweets. Its serene temples and traditional teahouses serve as picturesque settings for savoring seasonal dishes crafted with meticulous artistry. Kyoto’s emphasis on seasonal ingredients ensures that every meal is a celebration of nature’s bounty.

    4. Gaziantep, Turkey: The Gastronomic Treasure of Turkey
      Recognized as Turkey’s culinary capital, Gaziantep is famous for its aromatic baklava, spicy kebabs, and rich pistachio desserts. Its vibrant bazaars are filled with spice shops and food vendors offering traditional flavors passed down through generations. For adventurous eaters, sampling the city’s renowned pistachio baklava is an absolute must.

    5. Singapore: A Culinary Crossroads
      Singapore’s multicultural food scene is a reflection of its diverse population. From hawker centers offering chili crab and Hainanese chicken rice to upscale restaurants serving fusion cuisine, the city provides a smorgasbord of flavors. Its ease of access to various Asian delicacies makes it a perfect destination for a comprehensive taste tour.

    6. Jakarta, Indonesia: Indonesia’s Culinary Gateway
      Jakarta blends traditional Indonesian flavors with modern twists. Staple dishes like satay, nasi goreng (fried rice), and gado-gado (vegetable salad with peanut sauce) are widely enjoyed. The city’s street vendors and bustling markets offer an authentic taste of Indonesia’s rich culinary heritage.

    7. Istanbul, Turkey: East Meets West in Every Bite
      Istanbul sits at the crossroads of Europe and Asia, offering a unique culinary experience. Its famous dishes include kebabs, fresh seafood, and the iconic Turkish breakfast spreads. Savoring a simit (bread ring) with Turkish tea while overlooking the Bosporus captures the city’s vibrant food culture perfectly.

    8. Tokyo, Japan: The Heart of Global Culinary Innovation
      Tokyo’s culinary scene is unmatched, with Michelin-starred restaurants and bustling food stalls alike. Sushi, tempura, ramen, and izakaya-style dishes highlight Japan’s culinary versatility. The city is also home to trendy cafes and dessert spots serving innovative treats that cater to modern palates.

    9. Shanghai, China: The Fusion of Tradition and Modernity
      Shanghai combines classic Chinese flavors with contemporary culinary trends. Dishes like xiaolongbao (soup dumplings) and Shanghainese hairy crab are local staples. Its cityscape of towering skyscrapers and historic alleyways offer countless opportunities for delightful culinary discoveries.

    10. Bandung, Indonesia: Culinary Paradise for Food Explorers
      Famous for its crispy fried chicken, street snacks, and vibrant street food markets, Bandung offers a relaxed yet flavorful culinary experience. It’s a haven for those wanting to explore Indonesian comfort foods beyond Bali.

    11. Huế, Vietnam: The Imperial Flavors of Vietnam
      Once Vietnam’s imperial capital, Huế specializes in refined dishes like royal beef noodle soup and savory crepes. Its culinary traditions focus on balanced flavors and delicate presentation, offering a historic taste of Vietnam’s royal cuisine.

    12. Hong Kong: East Meets West in a Food Paradise
      Hong Kong’s dynamic food scene features everything from traditional dim sum to innovative fusion dishes. Its bustling markets, sleek eateries, and historic tea houses make it a city where culinary tradition and modern innovation coexist seamlessly.

    13. Padang, Indonesia: The Epicenter of Rendang
      Famous for Indonesian spicy dishes, Padang is best known for its rich, slow-cooked rendang beef. The city’s food stalls and restaurants serve an array of flavorful meats and vegetables highlighting Indonesia’s diverse culinary influences.

    14. Hanoi, Vietnam: The Cradle of Vietnamese Cuisine
      Hanoi’s vibrant street food markets are famed for pho (Vietnamese noodle soup), bun cha (grilled pork with noodles), and fresh spring rolls. Its historic streets are lined with vendors eager to serve traditional flavors that have been perfected over centuries.

    15. Amritsar, India: Rituals and Flavors of Punjab
      Home to the Golden Temple, Amritsar offers hearty Punjabi dishes like sarson da saag, makki di roti, and the famous Amritsari kulcha. The city’s chaat street and traditional langar meals at the temple serve authentic, soul-satisfying Indian cuisine.

    Source: TasteAtlas (2025)