Tag: Statistics

  • Global Faith Trends: 99% in Pakistan, 17% in China

    Global Faith Trends: 99% in Pakistan, 17% in China

    Understanding Global Religious Trends

    Religion continues to shape societies around the globe, affecting cultural norms, daily practices, and community life. Recent insights from a Statista Consumer Insights survey conducted between January 2024 and March 2025 reveal compelling regional patterns regarding religious beliefs across different countries.

    Highly Religious Nations

    Dominance in Africa and the Middle East

    The survey highlights that many of the most religious countries are located in Africa and the Middle East. Nations such as Pakistan, Egypt, and Nigeria stand out, with an impressive 99 percent of adults in these regions identifying with a religious faith. This overwhelming affiliation reflects the significant role religion plays in daily life, culture, and politics within these nations, often guiding personal and collective values.

    Case Study: Nigeria

    Nigeria, in particular, exhibits a diverse religious landscape, with a mixture of Christianity and Islam coexisting. This demographic balance not only informs individual belief systems but also shapes societal interactions, community structures, and even national policies.

    Secular Regions

    The Case of China

    In notable contrast, China emerges as the most secular nation in the survey, with only 17 percent of adults identifying as followers of a religion. This statistic can largely be attributed to the historical marginalization of religious beliefs during the Communist era. The state’s policies aimed at controlling religious practice have significantly shaped cultural perspectives around faith.

    Other Secular Countries in Asia

    Following China, other relatively secular countries in Asia include Vietnam, Japan, South Korea, and Hong Kong. The shared characteristics of these nations often reflect modern secular values, philosophical ideologies, and the influence of Western thought.

    European Religious Dynamics

    Czechia: A Historical Context

    In Europe, Czechia stands out with only 30 percent of the population claiming adherence to a religion. This trend is linked to a historical backdrop marked by Communist rule and longstanding tensions with the Catholic Church. The evolution of religious thought in Czechia serves as a fascinating study of how historical events influence contemporary beliefs.

    Comparison with Eastern Europe

    Conversely, Eastern European nations such as Romania, Serbia, and Lithuania demonstrate higher levels of religiosity. Their experiences with socialism did not lead to the same degree of secularization, suggesting that cultural and historical contexts play a pivotal role in shaping religious identity across the continent.

    Western Religious Landscape

    In the West, Ireland is recognized as the most religious country, maintaining a strong cultural connection to Catholicism. Southern European nations like Greece, Italy, and Portugal also display high levels of religious faith, emphasizing the importance of tradition and community in these societies.

    Religious Affiliation in the Americas

    High Levels in South America

    On the American continent, Peru and Brazil are distinguished by their faith, with over 80 percent of adults identifying as religious. This strong connection to faith reflects the deep cultural roots of religion within these countries, influencing their social and political frameworks.

    The North-South Divide

    While Canada shows a more secular trend, other countries in both North and South America, aside from the mentioned exceptions, maintain consistent levels of religious belief. This pattern highlights a nuanced understanding of how geography influences spiritual affiliation on the continent.

    Implications of Religious Beliefs

    These findings illustrate the diverse landscape of religious belief across various countries. Understanding these trends not only fosters greater cultural awareness but also prompts discussions about the implications of faith on global stability, community interactions, and individual identities.
  • U.S. Executions Surge to 25 in 2024: A 20% Increase

    U.S. Executions Surge to 25 in 2024: A 20% Increase

    Overview of Executions in the United States

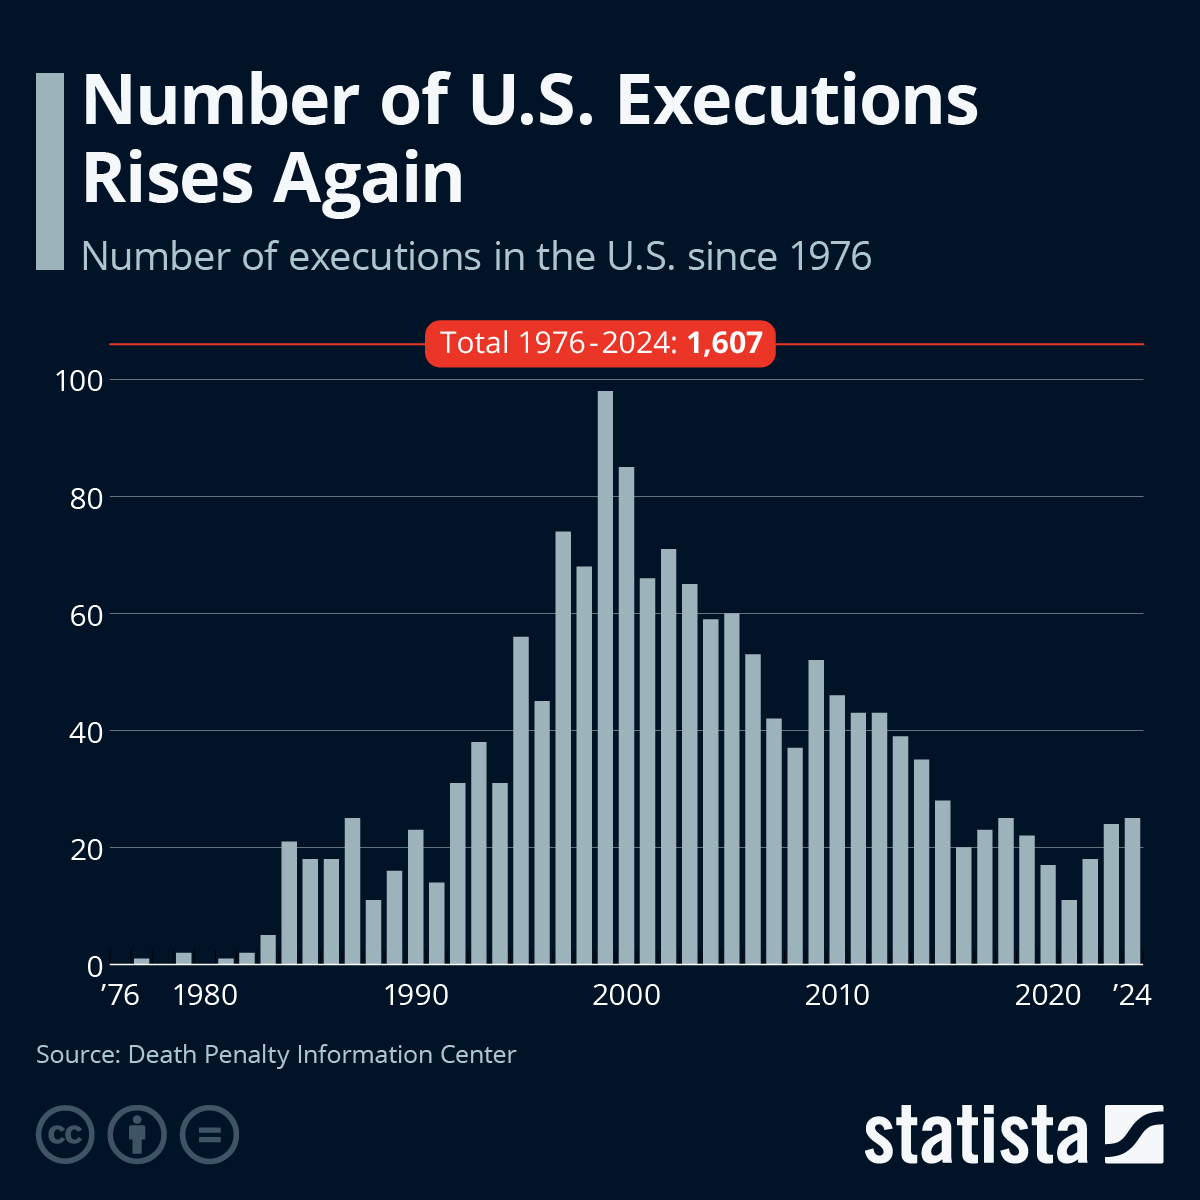
    The death penalty has a long and controversial history in the United States, with its trajectory notably shifting after the reinstatement of capital punishment in 1976. As of 2024, the number of executions has surpassed 1,600, marking a significant moment in the evolution of this contentious aspect of the justice system.

    Recent Trends in Executions

    In recent years, the number of executions in the U.S. has shown a notable increase. After experiencing dramatic lows during the COVID-19 pandemic, where executions dwindled to only 11 in 2021, the numbers have been on an upward trend with 18 executions in 2022, 24 in 2023, and reaching 25 in 2024. This resurgence reflects not only a shift in post-pandemic dynamics but also a response to changes in legal standards and drug availability for lethal injections.

    The Impact of Federal Executions

    The federal government’s re-engagement with capital punishment under former President Donald Trump has played a pivotal role in these figures. Resuming executions after a 17-year hiatus, the federal government executed 13 inmates in 2020 and 2021, significantly impacting national execution totals. Trump’s administration signaled a continued support for the death penalty, further influencing state-level decisions regarding capital punishment.

    Challenges in Lethal Injection Protocols

    The challenges faced by states in sourcing the drugs required for lethal injections have also contributed to fluctuations in execution numbers. A crucial policy change came in 2011 when the European Union banned the export of lethal drugs, further complicated when Pfizer withdrew its products from use in executions in 2016. These restrictions have left many states scrambling to find alternatives, often leading to postponed or botched executions as they experiment with different protocols.

    Alternatives to Lethal Injection

    With the difficulties surrounding lethal injections, some states have turned to alternative methods of execution. Nitrogen gas inhalation, for example, has been legalized in several states including Alabama and Mississippi. New protocols like this attract scrutiny and debate, particularly in light of botched executions that have made headlines in recent years.

    Historical Context of the Death Penalty

    Understanding the current climate regarding the death penalty in the U.S. requires looking back at the historical context. Since the reinstatement of capital punishment in 1976, Texas has dominated execution totals, leading with 592 executions. Other states with notable execution histories include Oklahoma, which has conducted 125 executions, and Virginia, which ceased executions after abolishing the death penalty in 2021.

    Execution Methods and their Evolution

    The methods of execution have also evolved over time, with electrocution remaining a legal option in eight states and becoming the default method in South Carolina. States like Louisiana have reintroduced the electric chair, while Utah and Tennessee have revived the firing squad in recent years. This diversification of execution methods reflects ongoing debates about humane practices within the scope of capital punishment.

    Recent Events and Milestones

    As of September 26, 2024, the milestone of 1,600 executions since the reinstatement of the death penalty was officially surpassed. On this date, two inmates were executed in separate states. Notably, Emmanuel Littlejohn was executed despite recommendations for clemency, while Alan Eugene Miller became one of the few individuals to die by nitrogen gas inhalation—a method still surrounded by controversy.

    Conclusion

    The landscape of capital punishment in the United States is continually evolving, marked by varying execution methods, increasing numbers, and legal challenges. The complex interplay of federal policy, state decisions, and societal attitudes towards the death penalty raises critical questions that remain at the heart of criminal justice discussions today.

  • Global Nurse and Midwife Shortages: 31 Nations Below 10/10K

    Global Nurse and Midwife Shortages: 31 Nations Below 10/10K

    Understanding the Global Health Crisis: The Role of Nurses and Midwives

    The Stark Reality of Maternal and Newborn Mortality

    Every year, close to 300,000 women die during pregnancy or childbirth—a staggering statistic that underscores the dire state of maternal health worldwide. Additionally, over two million babies lose their lives within their first 28 days of life, and another two million are stillborn. This persistent tragedy highlights a significant public health challenge that requires urgent attention.

    World Health Day: A Call to Action

    April 10 has been designated as World Health Day, a platform through which the World Health Organization (WHO) aims to focus global attention on critical health issues. This year’s campaign emphasizes the need for governments and health communities around the world to elevate their efforts to eliminate preventable maternal and newborn deaths. The theme centers around the recognition of the pivotal role that skilled healthcare professionals, particularly nurses and midwives, play in this fight.

    The Role of Nurses and Midwives in Maternal and Newborn Health

    The International Council of Nurses (ICN) and the Council of International Neonatal Nurses, Inc. (COINN) have been vocal about the essential contributions of skilled nurses working in supportive healthcare environments. Despite progress in reducing maternal and newborn mortality rates, the lack of adequate staffing continues to pose a significant risk to mothers and their newborns.

    The Importance of Skilled Care

    Skilled care provided by trained nurses and midwives is proven to reduce the risk of complications during pregnancy and childbirth. Their expertise not only aids in safe deliveries but also supports maternal and infant health through continuous care and education.

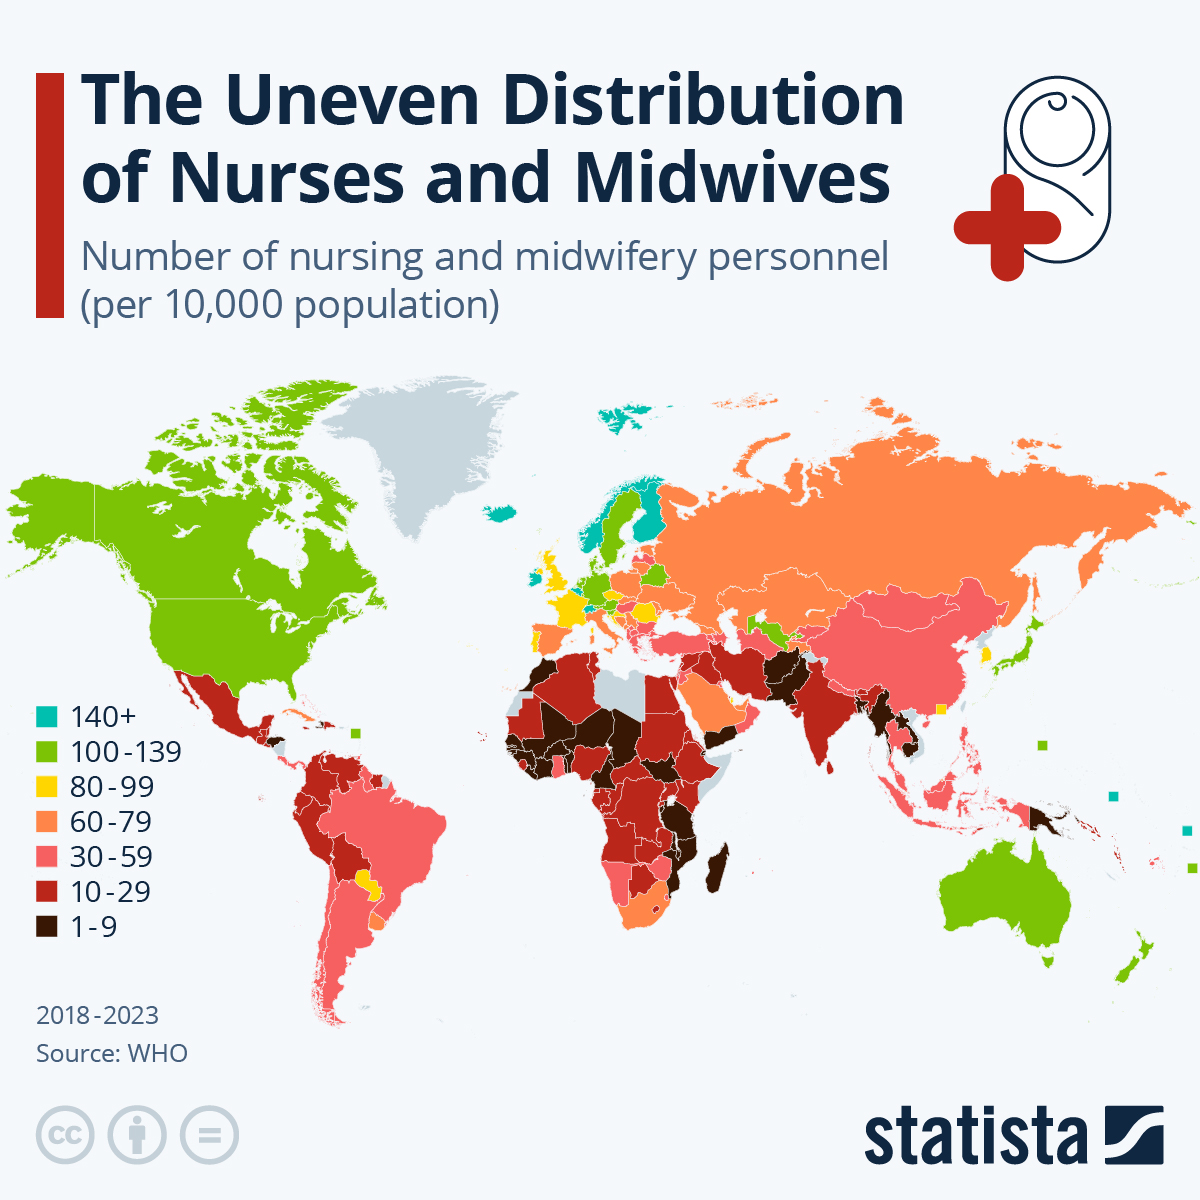
    The Global Distribution of Nursing and Midwifery Personnel

    The WHO’s data from 2018 to 2023 reveals an alarming disparity in the distribution of nurses and midwives globally.

    The Map of Inequality

    Based on the latest available data, a striking 31 countries and territories have fewer than ten nurses and midwifery personnel for every 10,000 people. This inequality is most pronounced in sub-Saharan Africa, where healthcare infrastructure is often under-resourced and overburdened.

    Regional Variations

    The disparities extend beyond mere numbers; they reveal profound regional variations:

    • China: As of 2022, the ratio stands at 37 midwives and nurses per 10,000 population.
    • Indonesia: In 2023, this figure is 32 per 10,000.
    • India: In 2020, there were only 17 midwives or nurses for every 10,000 people.
    • Cambodia: The situation is dire, with just 10 per 10,000 as of 2019.

    These statistics illustrate that while some regions have made progress in healthcare staffing, others like Cambodia and India remain critically underserved.

    The Implications of Staffing Gaps

    The uneven distribution of healthcare personnel has catastrophic implications for maternal and newborn health. Countries with fewer skilled healthcare providers face higher rates of preventable deaths. The gaps not only hinder immediate care but also affect the broader healthcare system, leading to long-term consequences for communities.

    The Way Forward: Addressing the Imbalance

    To make substantial progress in reducing maternal and newborn mortality, countries must prioritize the training, hiring, and retention of nurses and midwives. This involves increasing investment in healthcare infrastructure, ensuring that healthcare workers have the resources they need, and creating policies that support safe staffing levels.

    Recognizing the critical role that nurses and midwives play in the healthcare system is essential for creating a more equitable, effective, and responsive global health landscape.

  • Global Autism Diagnosis Rates: Top & Bottom Numbers Revealed

    Global Autism Diagnosis Rates: Top & Bottom Numbers Revealed

    Understanding Global Variations in Autism Diagnosis Rates

    Autism Spectrum Disorder (ASD) diagnosis rates exhibit significant disparities across different countries, influenced by various factors including healthcare access, awareness, and diagnostic practices. The variations shed light on the complexities of understanding autism on a global scale.

    Autism Diagnosis Rates by Country

    Recent data from the World Population Review highlights stark contrasts in autism diagnosis rates among countries.

    Countries with High Diagnosis Rates

    • Singapore: 1,460 per 100,000 children
    • Japan: 1,450 per 100,000 children
    • Australia: 1,160 per 100,000 children

    These countries are characterized by robust healthcare systems and high levels of public awareness regarding autism. The infrastructure in these nations may contribute to earlier and more frequent diagnoses.

    Countries with Low Diagnosis Rates

    • China: 638 per 100,000 children
    • Brazil: 606 per 100,000 children

    In contrast, countries like China and Brazil report significantly lower diagnosis rates. These figures may indicate under-diagnosis rather than a lower prevalence of ASD. Factors such as limited access to healthcare services and a lack of awareness about autism play pivotal roles in these statistics.

    Factors Affecting Diagnosis Rates

    The variations in autism diagnosis rates between countries are influenced by several key factors:

    Access to Health Services

    The presence of advanced healthcare systems allows for better identification and management of ASD. Countries with more resources are likely to have specialist centers, trained professionals, and screening programs that facilitate earlier and more accurate diagnoses.

    Diagnostic Methodologies

    Different regions may employ varied diagnostic criteria and methodologies when assessing autism. Some nations adhere to stringent guidelines, while others may have less standardized approaches, leading to inconsistencies in diagnoses.

    Public Awareness and Education

    A high level of public awareness regarding autism often correlates with increased diagnosis rates. Countries that emphasize education about ASD through campaigns and training programs tend to set a foundation for better detection of the disorder.

    Understanding Autism Spectrum Disorder (ASD)

    Definition and Impact

    ASD is defined as a developmental condition affecting how individuals perceive and interact with the world around them. It can lead to challenges in social interaction, communication, and the emergence of restrictive and repetitive behaviors. The term "spectrum" reflects the diverse range of symptoms and severity that can manifest in affected individuals.

    Observations from Global Data

    The higher prevalence of autism diagnoses in certain regions does not equate to a greater number of individuals with autism. Instead, it may signify more effective health systems capable of identifying and diagnosing the disorder. Conversely, regions with fewer medical resources may struggle with under-reporting, impacting the overall understanding of autism’s prevalence.

    Worldwide Awareness Initiatives

    April 2nd is recognized as World Autism Awareness Day, a global event aimed at raising awareness about ASD and promoting acceptance. This day serves as a platform for advocating for improved services and support for individuals on the autism spectrum and their families.

    By studying the various factors influencing autism diagnosis rates globally, we can better understand the complexities surrounding this developmental disorder and work toward more equitable healthcare solutions.

  • Top 5 Countries with Most Earthquakes Since 1990: A Ranking

    Top 5 Countries with Most Earthquakes Since 1990: A Ranking

    Understanding Earthquake Proneness: Myanmar’s Recent Disaster

    On a fateful Friday, a devastating 7.7-magnitude earthquake struck Myanmar, resulting in widespread destruction and a catastrophe that is believed to have claimed thousands of lives. Myanmar’s geographical positioning plays a critical role in this seismic vulnerability. Situated at the intersection of two tectonic plates, the country is no stranger to seismic activity, particularly along the Sagaing fault, which runs perilously close to major cities such as Yangon and Mandalay.

    The Sagaing Fault and Its Implications

    The Sagaing fault is a significant geological feature that poses a severe threat to the nation. Given its proximity to densely populated urban areas, any seismic activity along this fault can have catastrophic consequences. The city of Mandalay, home to over 1.7 million residents, now faces the repercussions of an earthquake that struck near its epicenter. The aftermath is particularly grim for residents in Sagaing, the provincial capital, where the devastation is felt most acutely.

    Tectonic Plates: A Risk Factor

    The destructive earthquake in Myanmar was primarily triggered by lateral movement between tectonic plates rubbing side by side. This type of tectonic interaction often results in large, shallow earthquakes that can affect vast areas, leading to extensive damage. While some of the world’s most earthquake-prone countries are located near convergent plate boundaries, Myanmar’s position along a transform plate boundary makes it vulnerable to sudden seismic events. This geological configuration places the country within the top 30 nations that have experienced the most significant earthquakes in the past 35 years.

    Building Infrastructure: A Critical Challenge

    The severity and destruction caused by the recent quake were further exacerbated by Myanmar’s poor adherence to building codes. Since the military junta took control in 2021, the country has been embroiled in civil strife, resulting in a lack of oversight and enforcement of safety regulations. This situation has rendered many of the newly constructed buildings susceptible to collapse during seismic events.

    Moreover, Myanmar’s rapid urbanization has seen a surge in the erection of modern buildings, most of which were poorly designed and built without following safety norms. Therefore, the risk to residents and infrastructure is magnified compared to previous decades, making the population increasingly vulnerable to such natural disasters.

    Asia’s Earthquake Hotspots

    While Myanmar is currently in the spotlight, it is not alone in facing the threat of earthquakes. According to data from the National Oceanic and Atmospheric Administration (NOAA), China and Indonesia are also among the countries with the highest number of earthquakes recorded since 1990, with 187 and 173 major quakes, respectively. Other Asian nations that frequently experience seismic activities include Japan, India, and the Philippines.

    The European Context

    In Europe, Greece and Italy are significant areas of concern regarding earthquake activity. Between them, they have reported 32 and 24 tremors since 1990, underscoring that seismic risks are not confined to the more well-known earthquake hotspots. These regions must continue to prioritize earthquake preparedness and infrastructure resilience.

    The Turkish and Syrian Catastrophe

    The seismic disaster in February 2023, which resulted in the deaths of nearly 60,000 people in Turkey and Syria, further underscores the dire repercussions of earthquakes. Turkey, which has experienced a staggering 65 major earthquakes since 1990, illustrates the ongoing threat posed by earthquakes to human life. Notably, six of these quakes had magnitudes of 7 or higher, compounding the challenge of disaster preparedness in the region.

    Middle Eastern Earthquake Proneness

    Iran is another country affected by significant earthquake activity, ranking among the countries with considerable seismic risks over the last several decades. Afghanistan also ranks as the 10th most affected nation, with 39 major earthquakes recorded since 1990.

    Latin America’s Earthquake Risks

    Turning to Latin America, Peru emerges as the country with the highest vulnerability to earthquakes in the region. The complex interplay of tectonic activity along the Pacific Ring of Fire, which encompasses various countries in this part of the world, contributes to the high incidence of seismic events in Peru and its neighbors.

    Through this detailed exploration of Myanmar’s recent earthquake and the broader context of global seismic activity, it becomes evident that the risks posed by earthquakes are complex and multifaceted.

  • 43% Boycott Brands Over Animal Cruelty, Survey Reveals

    43% Boycott Brands Over Animal Cruelty, Survey Reveals

    Understanding Brand Cancelation: The Reasons Behind the Boycott Movement

    In today’s socially conscious marketplace, consumers are more empowered than ever to hold brands accountable for their practices. Recent research by Statista highlights the primary reasons that lead consumers to boycott or protest against companies, revealing deep concerns regarding ethics and social responsibility.

    The Top Reasons for Brand Cancellation

    Animal Cruelty

    According to the survey conducted by Statista Consumer Insights, the foremost reason consumers choose to boycott a brand is due to animal mistreatment. In fact, 43% of over 3,000 respondents in the U.S. indicated that they would stop supporting companies that engage in practices they consider cruel to animals. This concern has risen to prominence across several Western countries, marking a significant shift in consumer priorities.

    Racism and Human Rights Violations

    Closely following animal cruelty, issues related to racism and human rights violations comprise another critical factor driving consumer boycotts. The survey shows that 42% of U.S. respondents cited racism, while 40% pointed to human rights abuses as significant deterrents to brand loyalty. These statistics underline the growing intolerance for unethical behaviors that impact marginalized communities.

    Environmental Concerns

    Environmental sustainability has become an increasingly vital aspect of corporate responsibility. In countries like Germany, respondents rated environmental concerns as a top reason for boycotting a brand—on par with human rights abuses. This perspective reflects a global recognition of the urgent need to mitigate climate change and reduce ecological harm.

    Health Risks and Misleading Advertising

    Interestingly, when examining consumer attitudes in Japan, there was a distinct emphasis on health risks associated with products and inappropriate advertising tactics. Japanese respondents prioritized the safety and integrity of products, suggesting a more health-conscious consumer base demanding transparency and authenticity from brands.

    Behavioral Insights from U.S. Consumers

    The survey not only sheds light on the reasons behind boycotts but also reveals consumer behaviors regarding brand engagement:

    Prevalence of Boycotting

    Approximately 13% of U.S. respondents admitted to having boycotted a brand in the past due to perceived unethical practices. This indicates that while many consumers express their willingness to actively support ethical business behaviors, only a fraction has translated this sentiment into action.

    Communication and Advocacy

    The survey also noted that 21% of consumers discussed their concerns about brands with friends, while 25% opted for social media platforms to broadcast their discontent. This highlights the role of social networks as influential space for consumers to rally support against companies they perceive as unethical.

    The Dichotomy of Intent vs. Action

    An intriguing finding from the survey is that while 86% of American respondents felt justified in boycotting or attacking a brand based on its practices, nearly half (49%) had never actually taken such action. This discrepancy calls into question the dynamics of consumer intent versus actual engagement, suggesting that while there’s significant awareness, it may not always translate to direct consequences for brands.

    Global Comparison of Concerns

    While the U.S. consumer landscape prioritizes animal cruelty, racism, and human rights violations, international perspectives vary. For instance, consumers in countries like Germany place equal weight on environmental issues, suggesting a more holistic view of corporate responsibility that includes the welfare of the planet. The contrast between these attitudes underscores the diverse values held by consumers around the world and indicates that brands must navigate a complex moral landscape.

    Cultural Differences in Consumer Attitudes

    Recognizing these cultural differences is imperative for brands operating in multiple markets. What resonates as a critical issue in one country may not hold the same weight in another, thus complicating the strategy for brand messaging and public relations across borders.

    The dynamics of cancel culture shed light on the increasing expectation for companies to align with ethical standards. With consumers wielding the power to shape brand reputations through their choices, businesses must remain vigilant and responsive to the concerns that drive today’s conscientious consumers.

  • 17.9% of U.S. Adults Experienced Long Covid Symptoms

    17.9% of U.S. Adults Experienced Long Covid Symptoms

    Who Is Most Likely to Get Long Covid?

    Long Covid has emerged as a significant concern in the aftermath of the pandemic, with many individuals experiencing lingering symptoms long after their initial COVID-19 infection. This blog delves into the demographics most affected by Long Covid, highlighting critical findings related to gender, age, and race.

    Understanding Long Covid

    Long Covid refers to a range of symptoms that persist for weeks or even months after the initial COVID-19 infection has resolved. Individuals suffering from Long Covid report various symptoms, including:

    • Insomnia
    • Headaches
    • Changes in taste or smell
    • Brain fog
    • Digestive issues
    • Respiratory problems

    Despite extensive research, the exact mechanisms behind Long Covid remain unclear. However, its impact on everyday life can be profound, affecting work, social interactions, and general well-being.

    Prevalence of Long Covid

    General Statistics

    According to recent data collected by the Census Bureau and the CDC, approximately 17.9% of U.S. adults reported experiencing Long Covid at some point. This statistic demonstrates the widespread nature of Long Covid across different populations.

    Gender Disparities

    A significant finding from the data is the pronounced gender disparity in the prevalence of Long Covid. The survey revealed that:

    • 21.8% of women reported having experienced Long Covid.
    • 13.9% of men reported the same.

    This striking difference raises questions about the underlying factors that may contribute to women experiencing Long Covid more frequently than men.

    Age as a Factor

    The age demographic also plays a crucial role in the likelihood of developing Long Covid. The data suggests that:

    • Individuals aged 40-49 are the most affected, with 7.0% reporting current symptoms of Long Covid.
    • Following closely are those aged 50-59, with 6.6% experiencing similar issues.
    • Younger adults, aged 18-29, reported Long Covid symptoms at a rate of 5.2%.

    These statistics indicate that middle-aged adults are particularly vulnerable to the long-term effects of COVID-19.

    Racial and Ethnic Disparities

    Higher Rates Among Minority Populations

    The data reveals that different racial and ethnic groups are affected by Long Covid at varying rates:

    • Approximately 20.3% of Hispanic or Latino adults have experienced Long Covid symptoms, surpassing the national average.
    • The percentage for non-Hispanic individuals of other races and multiple races is noted at 22.5%.

    These figures emphasize the need for targeted healthcare initiatives that address the unique challenges faced by these communities.

    Access to Care

    Researchers have pointed out that disparities in healthcare access may contribute to the higher rates of Long Covid among certain demographic groups. Vulnerable communities often face barriers that hinder their ability to obtain quality care, including:

    • Economic disparities
    • Structural racism within the healthcare system
    • Cultural stigmas surrounding health issues

    These factors may complicate the diagnosis and treatment of Long Covid, leading to underreporting and mismanagement of symptoms experienced by these populations.

    Conclusion

    By examining the demographics most affected by Long Covid, it becomes evident that this condition transcends individual experiences. It highlights broader societal issues related to healthcare access and the importance of ongoing research to unravel the complexities of this condition. Understanding who is most likely to get Long Covid is crucial for developing effective strategies to mitigate its impacts on society.

  • 117 Million Displaced: 58% Internally Displaced in 2023

    117 Million Displaced: 58% Internally Displaced in 2023

    The Global Crisis of Forced Displacement in 2023

    Understanding the Scope of Displacement

    In 2023, the world grappled with an alarming number of forcibly displaced individuals, estimated to be over 117 million. These figures, reported by the United Nations High Commissioner for Refugees (UNHCR), paint a stark picture of a humanitarian crisis shaped by war, violence, political persecution, and natural disasters. This blog aims to explore the factors influencing these displacements and the regions most affected.

    Internally Displaced Persons: A Significant Majority

    The Statistics Behind IDPs

    A noteworthy aspect of the displacement crisis is the predominance of internally displaced persons (IDPs), who make up approximately 58% of the total displaced population globally. Internally displaced individuals are people who have been forced to flee their homes but remain within their home country’s borders. This phenomenon often complicates relief efforts as these individuals cannot cross international borders to seek asylum.

    Key Regions Contributing to IDPs

    Recent conflicts have exacerbated the situation for IDPs, particularly in countries like Sudan. Here, an ongoing civil war has displaced over six million people. Additionally, around 1.2 million individuals have crossed borders, seeking refuge in neighboring countries. Such statistics underline the complex interplay of local conflicts causing widespread internal displacement.

    The Refugee Crisis: Global Hotspots

    Leading Countries of Origin

    Among those forcibly displaced, specific countries stand out in terms of refugee populations. In 2023, Afghanistan, Syria, Venezuela, and Ukraine were highlighted as the primary countries of origin for refugees. Each country’s unique circumstances—ranging from protracted conflicts to economic crises—have played a role in this displacement.

    The Role of Neighboring Countries

    Interestingly, a significant 70% of refugees find sanctuary in neighboring countries, indicating the regional impact of displacement. This situation often places immense pressure on host nations, challenging their resources and capacities to accommodate an influx of individuals seeking safety.

    Case Studies of Recent Displacement

    The Situation in Sudan

    The conflict in Sudan serves as a stark example of how internal violence can lead to vast numbers of displaced individuals. The ongoing civil war has not only created internal displacements but has also triggered a refugee crisis that affects surrounding nations. This dual displacement underscores the ripple effects of conflict.

    The State of Palestine: Gaza’s Crisis

    In late 2023, the situation in Gaza dramatically deteriorated, resulting from escalated conflict and bombardment. UNRWA reported that around 1.7 million Palestinians, roughly 75% of Gaza’s population, were forced to flee their homes. The humanitarian implications of such displacement are profound, raising questions about the future and well-being of these individuals.

    The Broader Humanitarian Impact

    Challenges Faced by Displaced Individuals

    The plight of forcibly displaced persons raises significant humanitarian concerns. Access to basic needs such as shelter, food, and healthcare becomes increasingly challenging, traumatizing entire communities. Additionally, mental health issues often arise due to the trauma of displacement, further complicating recovery efforts.

    International Response to Displacement

    In light of the expanding displacement crisis, international organizations and governments face pressures to respond effectively. Solutions must not only address immediate humanitarian needs but also consider long-term strategies for peace, stability, and integration of displaced populations into host communities.

    The Role of Policy and Advocacy

    Importance of International Cooperation

    To tackle the pressing issues surrounding forced displacement, international cooperation is critical. Nations must work together to facilitate safe asylum processes and resettlement options while also addressing the root causes of conflicts that lead to displacement.

    Advocacy for Vulnerable Populations

    Advocacy plays a key role in bringing attention to the needs of displaced individuals. By raising awareness and promoting policy changes, organizations can help ensure that the voices of those affected by displacement are heard and their needs addressed.

    The Future of Displacement Trends

    Projecting Future Displacement Scenarios

    In light of ongoing global conflicts and climate change, experts predict continued trends of forced displacement in the coming years. Understanding these patterns will be crucial for governments and organizations working to provide assistance and develop more comprehensive solutions to this escalating crisis.

    Role of Technology in Addressing Displacement

    Technology may offer novel solutions to some of the challenges faced by displaced individuals. From improving access to information about asylum processes to enhancing logistical support for humanitarian aid, innovative approaches are vital in addressing the evolving landscape of displacement.

  • 39% of Couples Met Online by 2017; 60.5M U.S. Users in 2024

    39% of Couples Met Online by 2017; 60.5M U.S. Users in 2024

    The Evolution of Online Dating: A Statistical Approach

    The Shift in Dating Norms Over Time

    The landscape of dating has undergone a dramatic transformation over the years. Dating, which once primarily occurred through social circles or introductions by friends, now predominantly happens through digital interfaces. In 1995, merely 2% of heterosexual couples met online, but this number skyrocketed to 39% by 2017. This paradigm shift illustrates not only technological advancements but also changing societal norms regarding intimacy and relationships.

    The Current Landscape of Dating App Users

    The Growing User Base

    As we look toward 2024, staggering statistics emerge regarding the user demographic in the United States. Statista Market Insights predicts that approximately 60.5 million individuals will engage with dating apps, encompassing both paying and non-paying users. This substantial figure indicates a growing acceptance of online dating as a viable means for forming romantic connections.

    User Penetration by Country

    Population density plays a crucial role in understanding the prevalence of dating apps across the globe. Notably, the United States stands out with a user penetration rate of 17.7%. This statistic is significantly higher compared to other countries surveyed, which include:

    • France: 11.2%
    • South Korea: 10.8%
    • Germany: 9%
    • Brazil: 7.8%
    • United Kingdom: 6.3%
    • China: 5.8%
    • India: 1.9%

    These figures highlight the varying cultural attitudes towards online dating and the accessibility of technology across different nations.

    Demographic Trends: Who’s Using Dating Apps?

    The Younger Generation’s Shift

    While dating apps have witnessed a surge in popularity, recent surveys from Statista Consumer Insights reveal that their appeal may be waning among the younger demographic. In 2023, only 26% of online dating service users in the U.S. were aged 18-29. This trend raises questions about the future of dating apps and how younger users may prefer other avenues for meeting potential partners.

    Popularity of Dating Platforms

    As of 2023, Bumble has emerged as the leading dating platform in the United States. Following closely behind are Tinder, Plenty of Fish, and Badoo. Each app offers unique features catering to different dating preferences, which may influence users’ choices based on their relationship goals—whether casual encounters or serious commitments.

    The Future of Dating Applications

    The current trends suggest that the online dating landscape is on the cusp of further evolution as consumer preferences shift. Factors such as user demographics, cultural shifts, and the technological environment will play pivotal roles in determining how dating applications adapt to meet the changing needs of users. As we continue to explore these dynamics, it becomes increasingly essential to keep an eye on this space to understand the future of romantic connections.

  • 35% See U.S. and China as Dominant Powers in Global Order

    35% See U.S. and China as Dominant Powers in Global Order

    The 61st Munich Security Conference: A Critical Analysis of Global Power Dynamics

    The ongoing landscape of international security is under scrutiny as the 61st Munich Security Conference unfolds this weekend. The conference brings together policymakers, leaders, and experts to discuss pressing global issues while releasing insightful annual reports that dissect the state of global security and the international order. This year, the focus has shifted toward the evolving notion of "multipolarization" in world politics, highlighting the growing divisions between traditional superpowers.

    Understanding Multipolarization

    The term multipolarity refers to a geopolitical landscape in which multiple nations hold significant power and influence, as opposed to a unipolar or bipolar system dominated by one or two major powers. This shift to multipolarity has crucial implications for global diplomacy and security strategies, raising questions about collaboration, governance, and the potential for conflict among rising powers.

    Key Findings from the Munich Security Conference Report

    The report released ahead of the conference paints a complex picture of today’s international order, particularly emphasizing the challenges posed by widening rifts between recognized superpowers. The authors express concern over how these divisions could complicate collective responses to global threats, such as pandemics, terrorism, and climate change.

    The Divisions Among Superpowers

    As countries negotiate their positions on the world stage, divisions appear to be growing. The report argues that these divisions hinder cooperation on critical issues, making it increasingly difficult for nations to approach crises with a united front. The traditional alliances are being tested, and the concept of shared governance is strained as nations become more assertive about their individual interests.

    The Role of China in the Evolving World Order

    The report singles out China as a significant proponent of a multipolar world order. As the country maneuvers to establish itself firmly as a global superpower, it may capitalize on the United States’ potential withdrawal from its international commitments. This shift could see China filling the void left by the U.S., especially in regions where Washington has historically had significant influence.

    Impact of U.S. Foreign Policy

    The forthcoming U.S. elections and the possibility of Donald Trump’s re-election add another layer of complexity. Should Trump return to office, his tendency to alienate long-standing allies could further open opportunities for China to enhance its global standing. As the U.S. navigates internal divisions and foreign engagements, other nations may leverage these changes to bolster their own positions in the global hierarchy.

    Perspectives from Around the Globe

    The report also incorporates survey data from various nations, revealing differing perceptions of power dynamics. Notably, countries like Japan, India, and even the U.S. view America as the current dominant superpower, reinforcing the notion of America’s traditional hold on international affairs.

    Diverse Outlooks on Global Power

    More than a third of respondents from 11 countries regard both the U.S. and China as dominant powers. Importantly, nearly 24% of those surveyed believe that in today’s world, various other powers can significantly influence global affairs, indicating a recognition of the shifting dynamics that accompany multipolarity.

    The Opportunity for Smaller Nations

    In this landscape of evolving power, smaller nations might find opportunities to assert their influence amid the fractures between major powers. As traditional alliances become less predictable, emerging nations can carve out their roles in international relations, potentially leading to new coalitions and partnerships that redefine global governance structures.


    This analysis illustrates the intricate web of power dynamics discussed during the 61st Munich Security Conference. As superpowers navigate their roles and emerging nations seek new pathways to influence, the global order remains in flux, raising critical questions about future cooperation and conflict in the international arena.

  • 20% of Americans and French Distrust Mainstream Media

    20% of Americans and French Distrust Mainstream Media

    The Growing Distrust in Mainstream Media: A Global Perspective

    Understanding Distrust: A Comparative Analysis

    In recent years, the issue of trust in mainstream media has taken center stage, particularly in Western countries. A survey conducted by Statista Consumer Insights indicates a concerning trend: substantial portions of the population in various countries express skepticism towards their media outlets. This blog delves into the degrees of distrust across nations, particularly focusing on the United States, France, Spain, Switzerland, and China.

    Distrust in the United States and France

    High Levels of Distrust

    The survey reveals that approximately 20% of respondents in both the United States and France openly express a lack of trust in mainstream media. This significant percentage places these two countries at the forefront of media skepticism among the 21 nations surveyed. This distrust can be attributed to various factors, including political polarization, sensationalism in reporting, and perceived biases in news coverage.

    The Impact of Partisanship

    In the U.S., trust in media tends to be closely tied to political affiliation. Many individuals believe that mainstream media outlets favor certain political viewpoints, which exacerbates distrust among those who feel misrepresented. Similar trends can be observed in France, where media coverage of political events is often scrutinized for partiality.

    The Situation in Spain

    Emerging Skepticism

    In Spain, 19% of respondents reported distrust in mainstream media, reflecting a sentiment similar to that observed in the U.S. and France. This skepticism is not entirely surprising, considering Spain’s turbulent political landscape and the rise of various political factions that continuously criticize traditional media outlets. The public increasingly turns to alternative news sources, which can sometimes lead to echo chambers of information.

    Contrast with Switzerland and China

    Swiss Confidence in Media

    Conversely, Switzerland stands out in this survey, with only 13% of respondents conveying distrust toward their mainstream media. The Swiss media landscape is often viewed as robust and reliable, characterized by high journalistic standards and a tradition of neutrality. This cultural context fosters greater public trust, enabling news organizations to maintain credibility.

    Analyzing China’s Perspective

    China presents another unique scenario; fewer than 10% of respondents indicated any distrust in their mainstream media. This is reflective of the controlled media environment in the country, where the government exerts significant influence over news reporting. While this results in limited dissenting voices, it creates a perception of stability in information dissemination among the population.

    Factors Influencing Trust

    The Role of Digital Media

    The rise of digital media has fundamentally altered how individuals consume news. The proliferation of social media platforms allows for instantaneous sharing of information, but this can also lead to misinformation. As users grapple with competing narratives, the trustworthiness of traditional media is called into question.

    Critical Media Literacy

    Furthermore, a lack of media literacy can exacerbate distrust. As individuals become more adept at navigating information online, the ability to critically engage with news content varies widely. In countries where media education is prioritized, such as Switzerland, this could explain higher levels of trust in traditional media outlets.

    Conclusion

    This pervasive trend of distrust in mainstream media across various countries highlights a need for dialogue and reform within the industry. Understanding the factors contributing to this skepticism can help media organizations better engage with their audiences and improve their credibility.

  • California Wildfires: 600K Emergencies, 1M Acres Burned in 2024

    California Wildfires: 600K Emergencies, 1M Acres Burned in 2024

    The Increasing Impact of Wildfires in California

    An Overview of Recent Wildfire Incidents

    The recent wildfires in California, particularly the one that erupted in the Pacific Palisades neighborhood of Los Angeles County, have raised grave concerns about fire safety and management. At one point, the largest fire threatened nearly 3,000 acres, prompting immediate evacuations for tens of thousands of residents, including calls from Malibu’s officials for everyone to be prepared for possible evacuation. Such incidents hurled the community into chaos, with firefighters battling the flames amid challenging conditions exacerbated by Santa Ana winds.

    Governor’s Response to the Wildfire Crisis

    As the fires intensified, California Governor Gavin Newsom took swift action by deploying over 1,400 firefighting personnel to confront this unprecedented crisis. His announcement on social media platform X highlighted the seriousness of the situation and the state’s commitment to tackling wildfires head-on. With a containment rate initially reported at zero percent according to Cal Fire statistics, the urgency of the moment became apparent, underscoring the need for timely responses in times of natural disasters.

    Historical Context of Wildfires in California

    A Growing Trend of Wildfires

    Wildfires have plagued California for decades, driven by a combination of factors including climate change, increased temperatures, and prolonged droughts. The year 2024 alone saw over 600,000 emergency responses tied to wildfires, with more than one million acres of land scorched. The largest single fire of the year, the Park Fire, burned a staggering 430,000 acres across Butte and Tehama counties, highlighting the vast scale of the destruction.

    Emergency Responses and Area Affected

    While 2024 statistics indicate elevated emergency responses compared to the five-year average, the land and structures affected by wildfires did see a relative decrease. This anomaly can largely be attributed to the significantly lower amount of acreage burned in the preceding years of 2022 and 2023. Nevertheless, the overall trend suggests a marked increase in wildfire frequency and severity, which poses an escalating risk to communities across California.

    The Financial Toll of Wildfires

    Fire Suppression Costs Increasing Dramatically

    The financial implications of wildfires are daunting and reflect a broader trend of increasing expenditures for fire suppression efforts. Historical data from the California Department of Forestry and Fire Protection reveals that expenses for fire management were approximately $69 million in the fiscal year 1994/1995. In contrast, preliminary figures for the 2024/2025 fiscal year project such expenses to soar to around $700 million, illustrating the escalating economic burden of wildfire management.

    The Role of Urban Expansion

    Another critical factor contributing to the rising costs and impacts of wildfires is the expansion of residential settlements into forested areas. As more people choose to live near wildlands, the risk of fire-related damage increases substantially. The juxtaposition of homes and natural landscapes creates potential hazards, making both evacuation and firefighting efforts more complicated when fires inevitably strike.

    Implications for California’s Future

    The ongoing battle against wildfires in California highlights several key areas for concern. The escalating nature of these events signifies a need for not only more robust firefighting resources but also a strategic change in land management and urban planning policies. As climate patterns become increasingly unpredictable, it is paramount for residents, government officials, and emergency services to work together to mitigate the impacts of future wildfires and to ensure the safety of communities at risk.

  • 2023 EU Migration: Only 9% Are Irregular Entries

    2023 EU Migration: Only 9% Are Irregular Entries

    Understanding EU Migration: The Role of Irregular Entries

    Migration within the European Union has been a topic of extensive discussion, particularly in light of recent political narratives. It’s important to examine the factual landscape of migration, especially concerning the notions of irregular migration versus legal migration. The statistics speak for themselves, revealing a more complex picture than often portrayed.

    The Current Landscape of Migration in the EU

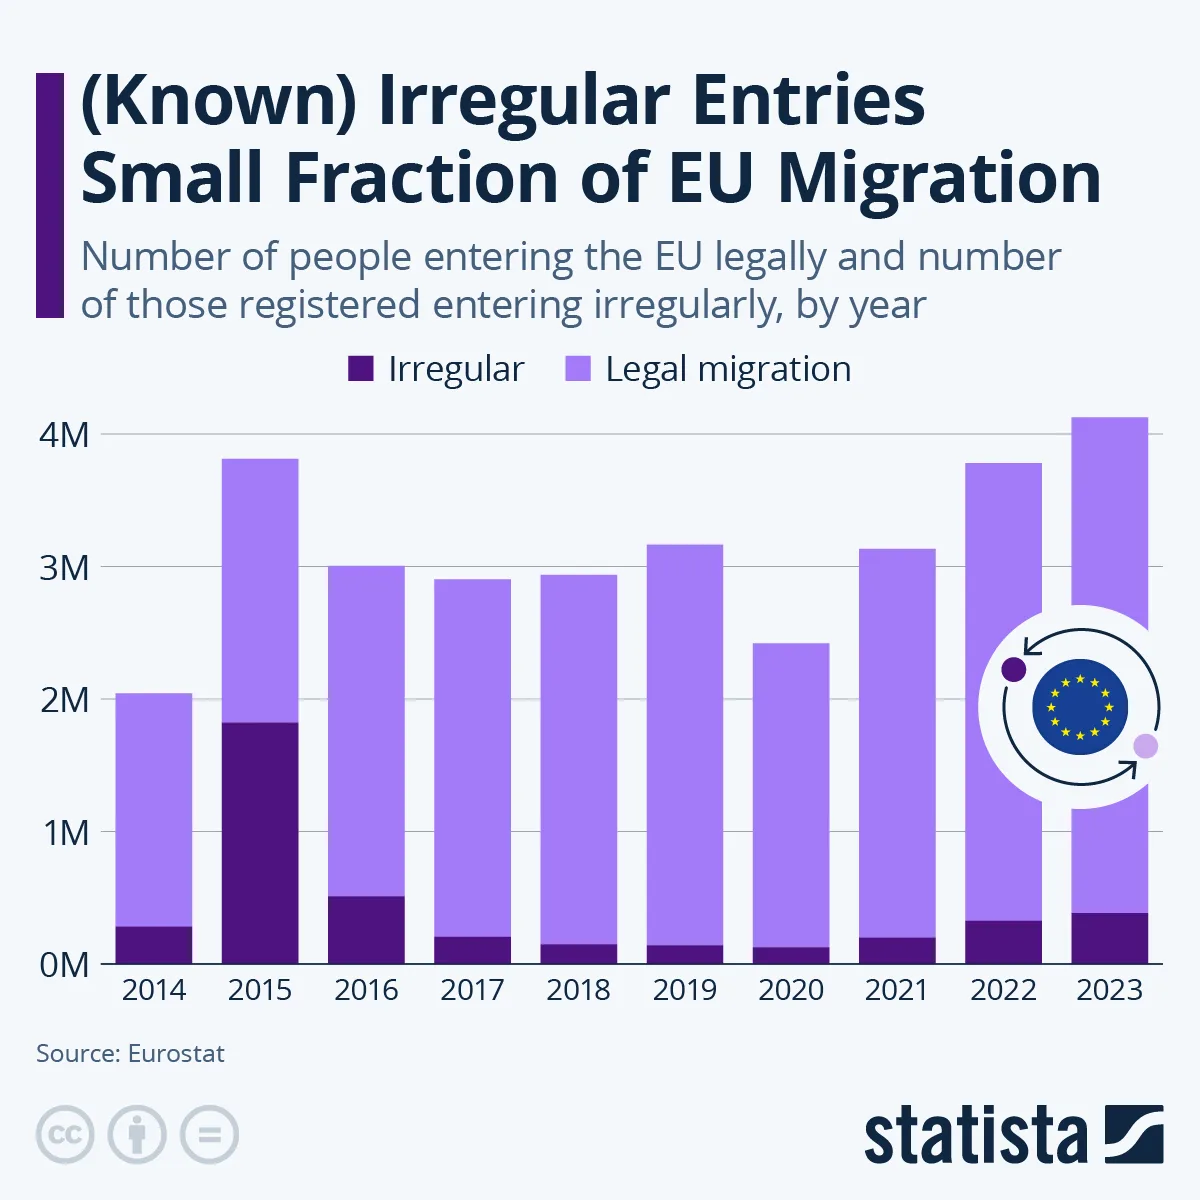
    According to Eurostat data, the migration landscape in the EU saw significant movement in 2023, with approximately 4.1 million individuals migrating to the region. This figure underscores the dynamic nature of migration and the various factors driving people to seek opportunities within the EU.

    Legal vs. Irregular Migration

    A key aspect of this migration is the distinction between legal and irregular migrants. In 2023, less than nine percent of those who migrated were classified as irregular migrants. This statistic serves to highlight that the overwhelming majority of individuals moving to the EU are doing so through legal channels.

    • Legal Migration: This category encompasses those who enter the EU with visas, work permits, and other formal pathways that align with immigration regulations.
    • Irregular Migration: This involves individuals who enter the EU without proper documentation or who overstay their visas. While a matter of public concern, irregular migration constitutes only a small fraction of total migration flows.

    Historical Context of Irregular Migration

    To understand the significance of the current data, it is helpful to look back at trends in migration. The year 2015 marked a turning point in Europe’s migration policy, characterized by a notable surge in irregular migration, which led to widespread political and social debates.

    The Peak of Irregular Migration

    During the height of the migration crisis in 2015, irregular migrant arrivals reached unprecedented levels:

    • Volume: The influx of individuals seeking asylum and a better life overwhelmed many EU nations, leading to a scramble for effective policy responses.
    • Policy Implications: The crisis prompted the EU to rethink its approach to immigration, culminating in stricter border controls and collaborative efforts among member states to manage migration flows.

    Current Trends in Migrant Arrivals

    Fast forward to 2023, and the dynamics of migration have changed significantly. Last year’s surge in migrant numbers, driven primarily by legal avenues, illustrates a shift in patterns.

    Analyzing the Numbers

    • Legal Migrant Dominance: The latest data reveals that the spike in arrivals is almost entirely due to individuals migrating through established legal routes rather than an increase in irregular entries.
    • Comparative Analysis: Current irregular migration figures are substantially lower than the peak levels recorded in 2015, indicating that the EU has made strides in managing and regulating migration flows more effectively.

    Political Perspectives on Migration

    Despite the data indicating a relatively low percentage of irregular migrants, political discourse around migration remains fraught with differing opinions. Politicians express varying beliefs about the implications of migration, often fueling public sentiment and policy decisions.

    The Role of Rhetoric

    The narratives surrounding migration can significantly influence public perception. For some politicians, emphasizing irregular migration serves to evoke concerns about security, social services, and the strain on national resources.

    • Debates and Policies: As these narratives unfold, they shape legislative actions aimed at tightening immigration controls or, conversely, supporting humanitarian efforts to assist migrants.

    Conclusion (not included as per instruction)

    To explore further, continue examining how migration dynamics evolve with policy changes, economic conditions, and global events impacting migration flows into the EU. This complex web reflects not only statistical data but also the human stories and experiences that lie behind the numbers.

  • Guinea: World’s Deadliest Road with 37 Deaths per 100K

    Guinea: World’s Deadliest Road with 37 Deaths per 100K

    Understanding Road Traffic Fatalities: A Global Perspective

    Road traffic injuries have drastically altered the landscape of public health, emerging as a leading risk factor for death, particularly among younger populations. This has prompted global organizations to take action, aiming to address and mitigate the factors contributing to these alarming statistics.

    The Scope of the Issue

    According to the World Health Organization (WHO), a staggering 1.19 million lives are lost to road accidents globally each year. This dizzying number has become a focal point for health agencies and governments alike, with the United Nations General Assembly targeting a 50% reduction in these fatalities by 2030. This ambitious goal underscores the scale of the public health crisis that road traffic injuries pose.

    Vulnerable Populations

    The demographic most affected by road traffic injuries are individuals aged between 5 and 29 years. Within this age group, road traffic injuries have emerged as the leading cause of death. This alarming trend is compounded by the fact that over half of all road traffic deaths are attributed to vulnerable road users, including pedestrians, cyclists, and motorcyclists. This raises critical questions about urban planning and the need for improved infrastructure that protects these groups.

    A Global Crisis with Regional Disparities

    While road safety is indeed a global issue, the severity varies drastically across different regions. An alarming statistic reveals that up to 90% of road traffic deaths occur in low- and middle-income countries. The World Bank has indicated that the increase in vehicle ownership in these regions has outpaced improvements in road safety management, infrastructure, and regulatory enforcement.

    Spotlight on Fatality Rates: Guinea and Other High-Risk Areas

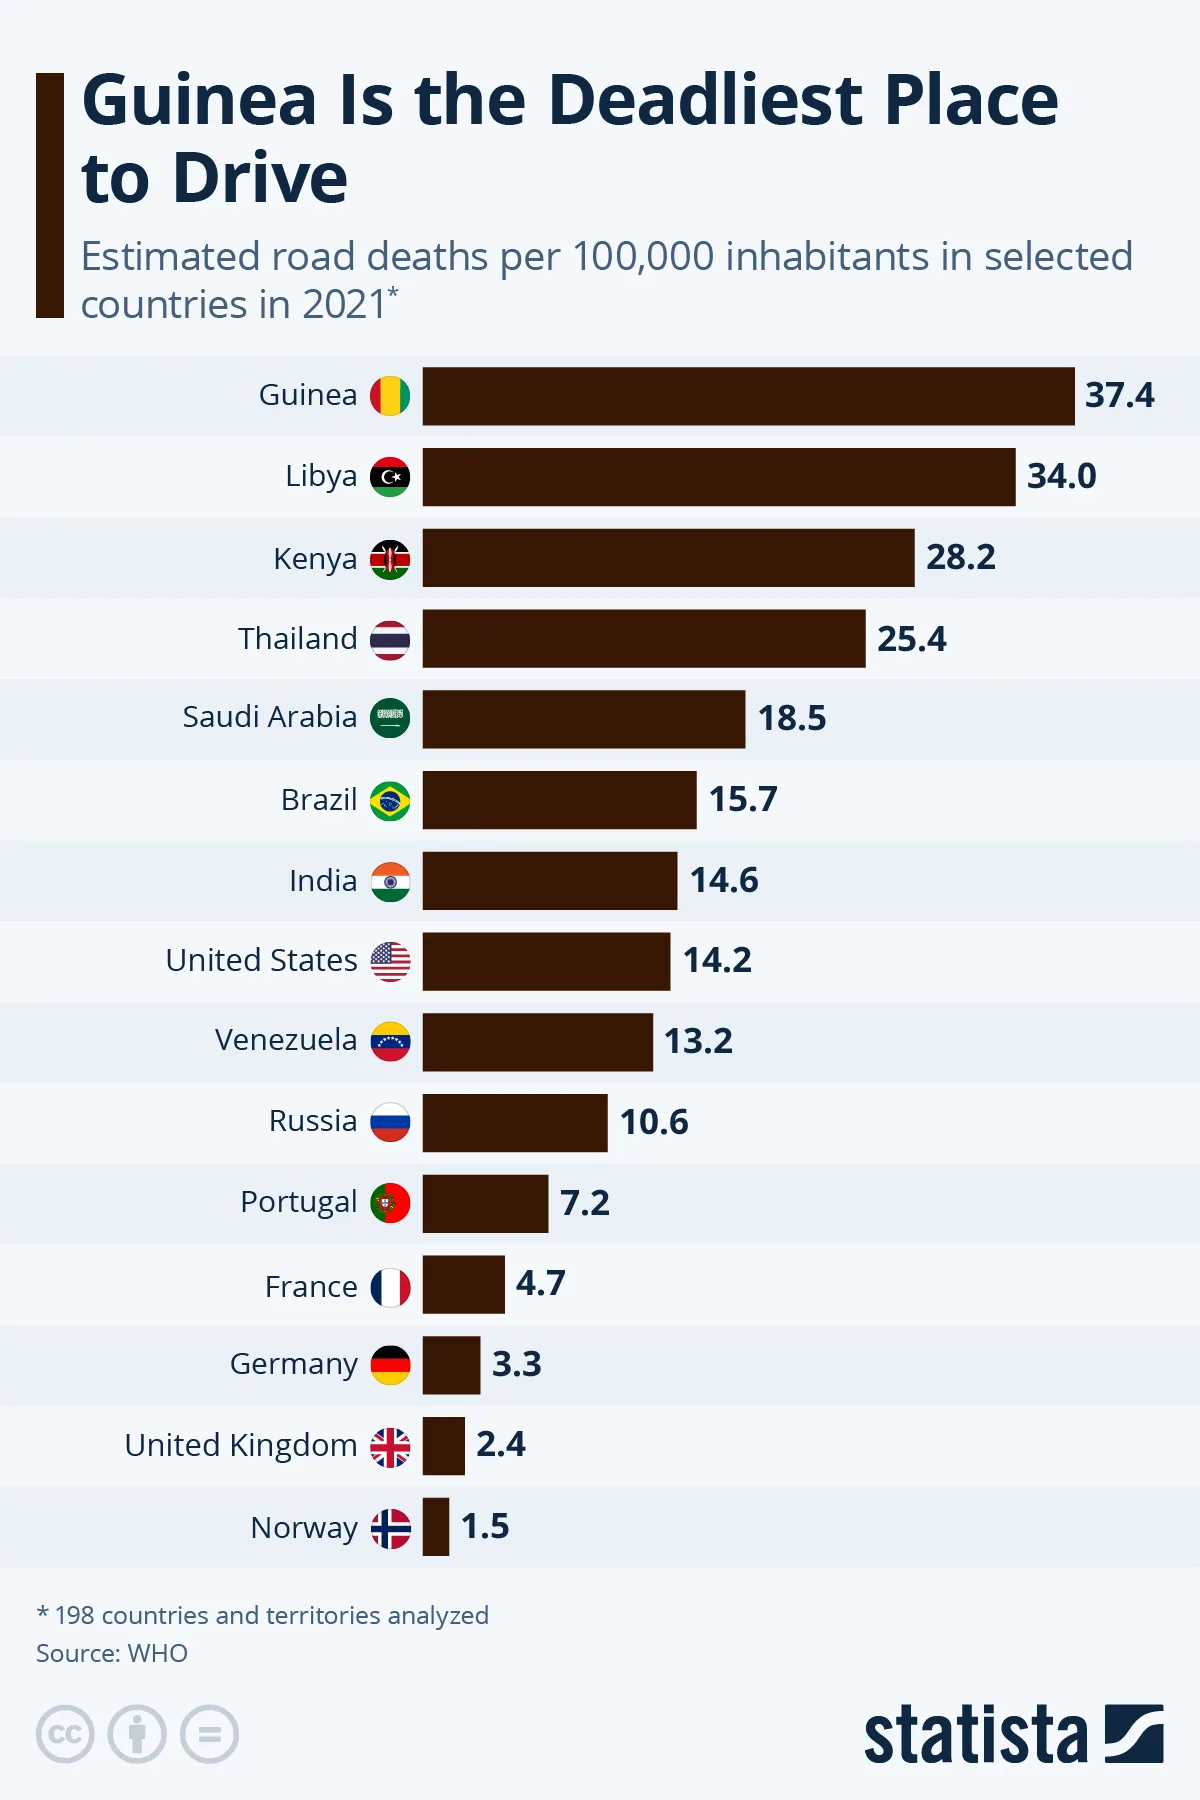
    Recent data from the WHO has spotlighted Guinea as the country with the highest road traffic death rate, recording 37 deaths per 100,000 inhabitants in 2021. Following closely are Libya and Haiti with rates of 34 and 31 deaths per 100,000 respectively. The alarming trend in these countries highlights a pressing need for intervention and better road safety practices.

    The African Continent: A Particularly Dangerous Landscape

    Africa stands out with the highest road traffic death rates globally, claiming 12 of the 20 deadliest countries for road deaths. With such staggering figures, there is an urgent call to action for governments and organizations to invest in road safety measures tailored to the unique challenges faced in these regions.

    A Comparison: Developed versus Developing Nations

    In stark contrast, the United States registered approximately 14 road traffic deaths per 100,000 population in 2021, ranking 79th in the world for road fatalities. This comparative perspective highlights the disparity in road safety measures, enforcement of traffic laws, and overall infrastructure quality between more developed nations and those still grappling with such fundamental issues.

    Key Takeaways

    The data presents a sobering reality that road safety is a multifaceted challenge requiring concerted efforts from various stakeholders. Understanding the geographic disparities in road safety can help shape policies and interventions aimed at reducing fatalities and creating safer roadways for all users.

  • Nearly 18% of U.S. Teens Faced Depression in 2023

    Nearly 18% of U.S. Teens Faced Depression in 2023

    The Rising Tide of Teen Depression: An Examination of Current Trends

    Understanding the Statistics

    Recent research shows that nearly 18.1% of U.S. teenagers aged 12-17 experienced a major depressive episode in 2023. This statistic marks a substantial increase from the 7.9% reported in 2006. Although this percentage has decreased from its peak of 20.1% during the pandemic in 2021, it remains higher than the figures recorded in 2019 and 2020. The data from the U.S. Substance Abuse and Mental Health Services Administration outlines a growing concern among different demographics of adolescents.

    Defining Major Depressive Episodes

    A major depressive episode, as classified by mental health services, is identified through specific criteria. Respondents must report having experienced a two-week period or longer in which they felt persistently depressed or lost interest in daily activities. Additional symptoms include difficulties with sleep, appetite changes, fatigue, concentration issues, diminished self-worth, and recurring thoughts of death or suicidal ideation.

    Demographic Breakdown of Depression Rates

    Multiracial Adolescents

    Among various demographic groups, Multiracial teens exhibit the highest rate of reported depressive episodes, standing at 24.4% in 2023. This statistic suggests that integrated cultural identities may present unique challenges, contributing to higher levels of mental distress.

    White Adolescents

    Following closely are white adolescents, with a depressive episode rate of 19.6%. This trend prompts further exploration of socio-economic and environmental factors that may influence mental health outcomes within this demographic.

    Asian and Black Adolescents

    Asian teens reported a depressive episode rate of 13.7%, while Black adolescents showed a slightly lower rate of 13.3%. Both groups highlight significant mental health concerns that warrant attention, particularly as societal pressures, cultural expectations, and disparities in access to mental health resources come into play.

    The Role of Social Media and Technology

    The Connection to Mental Health

    The ongoing discourse surrounding mental health issues among teens has been reignited by the publication of "The Anxious Generation" by Jonathan Haidt. This work suggests a direct link between the explosion of social media usage and the deterioration of adolescent mental health. Critics, however, caution against conflating correlation with causation and emphasize the complexity of mental health issues.

    Impacts on Development

    Haidt argues that social media and smartphones detract from essential developmental experiences for children and teenagers, such as face-to-face interactions, sleep hygiene, and self-esteem development. He posits that even youths who aren’t directly engaged with social networks are still affected by the societal shifts induced by technology, indicating a broader cultural impact that influences adolescent experiences and challenges.

    The Broader Scope of Mental Health Issues

    Depression Beyond Social Media

    While the impact of social media on mental health is a credible concern warranting attention, it is important to recognize that various other factors contribute to adolescent depression. Academic pressures, family dynamics, social isolation, and socioeconomic challenges also play significant roles in shaping mental health outcomes for teens.

    The Importance of Comprehensive Data

    Despite the insights offered by current studies, many experts argue that the available data may not capture the full picture of adolescent mental health trends. There is a need for ongoing research to better understand the myriad factors contributing to increased rates of depression among teens.

    Sociocultural Implications

    The issues at hand regarding teenage mental health reflect deeper sociocultural trends. With an increased focus on mental health awareness, there is potential for greater advocacy and policy changes aimed at supporting the mental well-being of the younger population. Understanding the intricacies of these statistics and their implications is crucial for fostering a supportive environment for teens navigating these challenges.

    Addressing the Crisis

    The rising rates of depressive episodes among U.S. teens signal an urgent need for societal intervention. Initiatives aimed at reducing mental health stigma, promoting balanced social media use, and ensuring accessible mental health services are essential for helping adolescents build resilience and cope effectively with the pressures they face. As these trends continue to evolve, it is vital to keep the conversation active and prioritize mental health resources tailored for the youth demographic.

  • Global Education Challenges: 33% Cite Ideological Bias in U.S.

    Global Education Challenges: 33% Cite Ideological Bias in U.S.

    Global Challenges Facing Education: Insights from Recent Survey Data

    Overview of the Ipsos Study

    A recent Ipsos report, based on a survey of more than 1,000 respondents from 30 countries, sheds light on the various challenges facing educational systems around the globe. Conducted between June 21 and July 5, 2024, the survey reveals a rich tapestry of perspectives on the state of education, highlighting both concerns and areas of optimism among different nations.

    Key Concerns in the United States

    Ideological Bias in Education

    In the United States, respondents expressed significant concerns regarding ideological bias within the educational system. An alarming 33 percent identified this as the foremost challenge, reflecting a growing anxiety about how educational content is influenced by political or ideological viewpoints. This sentiment was echoed by respondents from Hungary and Poland, both reporting a similar level of concern at 30 percent.

    Child Safety and Security

    Another pressing issue for U.S. respondents was the safety and security of children in educational settings. Approximately 31 percent of those surveyed indicated that concerns over child safety were paramount. This issue resonated similarly in France (30 percent), India, Mexico, and Brazil (each at 24 percent), underscoring a universal anxiety about the well-being of students in schools.

    Challenges in Indonesia: Access and Infrastructure

    In Indonesia, the concerns diverged significantly from those in the U.S. Here, an overwhelming 60 percent of respondents identified unequal access to education as the most significant issue facing their schooling system. This highlights the stark disparities in opportunities available to various student demographics.

    Inadequate Infrastructure

    In addition to access issues, 36 percent of respondents in Indonesia pointed to inadequate infrastructure as a critical challenge. This reflects broader concerns about the physical environment of schools, which can significantly impact the quality of education offered.

    Technology Utilization

    Furthermore, 30 percent lamented the insufficient usage of technology in education, pointing to the need for modernization and integration of digital tools to enhance learning experiences.

    The United Kingdom: Funding Concerns

    The survey results from the United Kingdom presented a different set of challenges, with 40 percent of respondents indicating a lack of public funding as the main issue facing their educational institutions. This was the highest figure recorded among the 30 countries surveyed, emphasizing the urgent need for financial investment in education.

    Comparisons with South American Countries

    Similar funding concerns were echoed across South America, where respondents in Colombia (37 percent), Chile (36 percent), and Brazil (35 percent) recognized limited financial resources as a significant hurdle. This pattern indicates a broader trend in which educational institutions struggle to maintain quality due to insufficient funding.

    Perceptions of Education in Asia

    While many countries grapple with significant challenges, the survey revealed a more optimistic view of educational systems in several Asian nations.

    Positive Outlook in India and Southeast Asia

    In India, an impressive 72 percent of respondents believed that the education system is contributing to reducing social inequalities. This optimism extended to other Southeast Asian nations, including Singapore (68 percent), Thailand (66 percent), Indonesia (64 percent), and Malaysia (63 percent). These figures suggest that many see education as a vital tool for social mobility and advancement.

    Negative Sentiments in Turkey and Hungary

    Conversely, respondents from Turkey (34 percent) and Hungary (30 percent) expressed a more pessimistic view regarding the effectiveness of their educational systems in addressing social inequalities. This stark contrast highlights the varying degrees of trust in education as a mechanism for societal improvement.

    Conclusion

    The Ipsos report paints a complex picture of global educational challenges and perceptions. While certain regions display significant concerns over ideological biases, funding shortages, and safety issues, others express hopefulness about the role of education in mitigating social inequalities. As countries navigate these diverse challenges, the insights gathered from this survey will be vital for policymakers and educators alike.

  • Top 3 Countries: Binge-Drinking and Their Surprising Stats

    Top 3 Countries: Binge-Drinking and Their Surprising Stats

    The Global Landscape of Binge Drinking

    Binge drinking is a pressing public health issue that affects countless individuals and communities across the globe. The phenomenon is often defined as consuming a substantial amount of alcohol in a single session, posing various risks to health, safety, and societal well-being.

    Understanding Binge Drinking

    Binge drinking typically refers to consuming more than six units of alcohol within a short time frame, often resulting in intoxication. Different countries have varied cultural attitudes toward drinking, and these attitudes can heavily influence binge-drinking rates. The World Health Organization (WHO) provides essential insights into global drinking patterns, revealing that specific nations experience substantially higher rates of binge drinking than others.

    The Top Countries for Binge Drinking

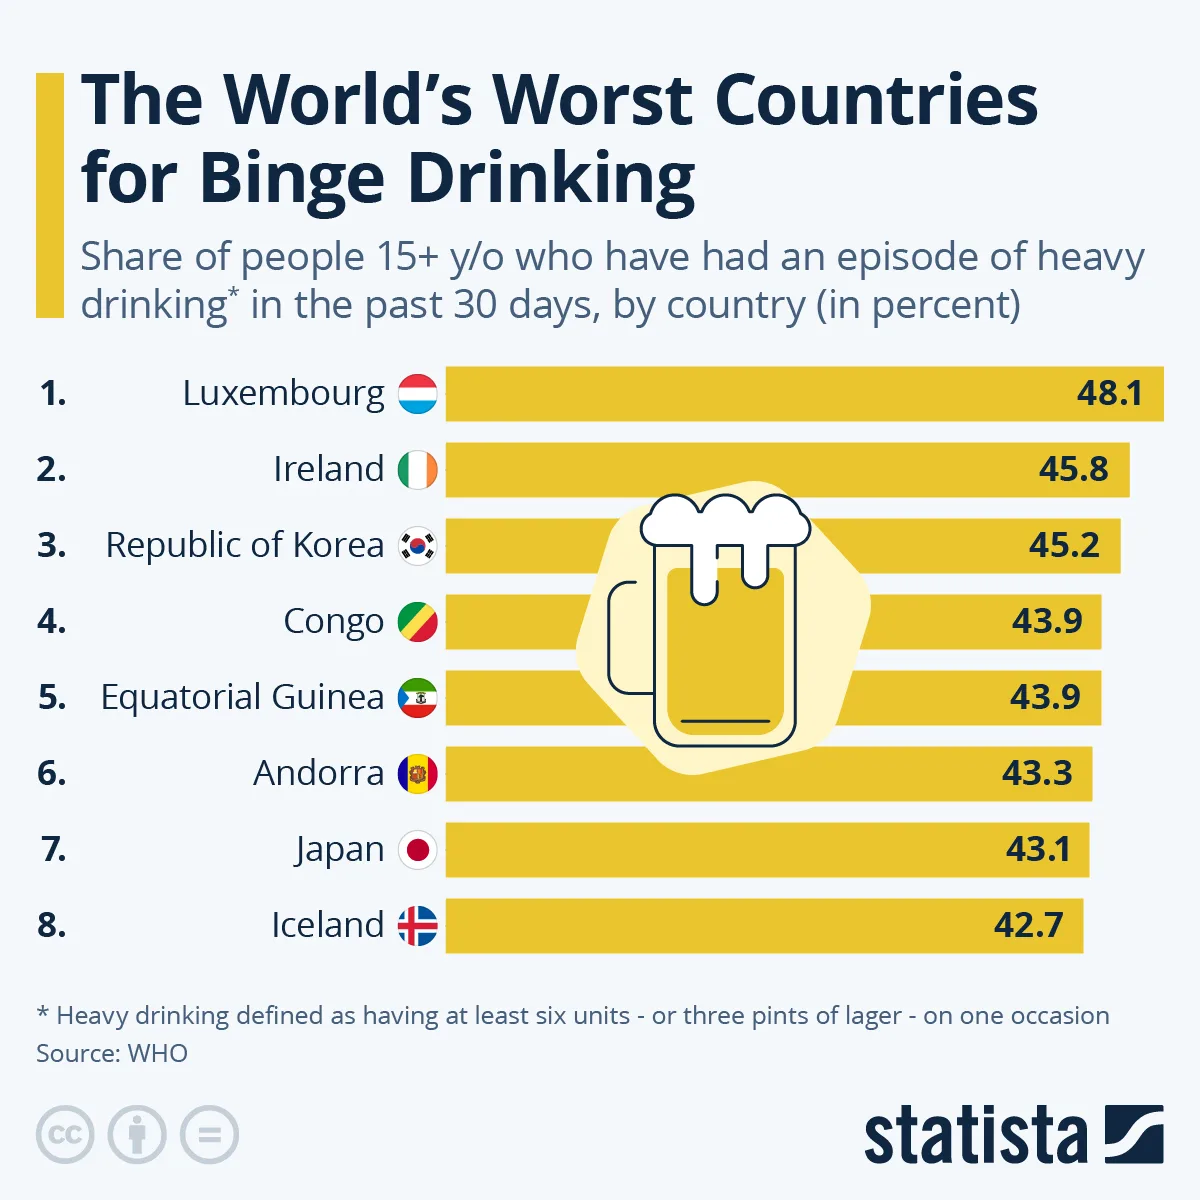
    According to the most recent data, Austria, Ireland, and Czechia (formerly known as the Czech Republic) have emerged as the frontrunners in binge drinking incidences worldwide. Let’s delve deeper into the drinking cultures and statistics of these countries.

    Austria: A Culture of Celebration

    Austria is known for its rich traditions that often involve the consumption of alcohol, particularly in social settings. Festivities, such as fairs and celebrations, frequently feature beer and wine, contributing to high consumption rates. The Austrian penchant for socializing means that drinking is often equated with enjoyment and camaraderie.

    Ireland: The Spirit of the Irish

    Ireland has long been associated with its vibrant pub culture. It’s a country where socializing over drinks is a significant part of the lifestyle. Irish people frequently engage in after-work drinks and weekend outings, leading to instances of excessive alcohol consumption. The stigma around excessive drinking in social contexts remains minimal, further fueling binge-drinking habits.

    Czechia: A Brewing Tradition

    Czechia boasts one of the highest beer consumption rates per capita in the world. The longstanding tradition of beer brewing, alongside the social significance of drinking, positions binge drinking as a common activity amongst the populace. The country’s historic breweries and festivals celebrate this culture, making excessive drinking more normalized.

    Health Implications of Binge Drinking

    The health repercussions associated with binge drinking cannot be understated. Frequent excessive consumption of alcohol can lead to:

    • Chronic Health Conditions: Long-term effects include liver disease, cardiovascular issues, and addiction disorders.
    • Mental Health Concerns: Alcohol misuse is often linked with anxiety, depression, and other mental health disorders.
    • Increased Risk of Accidents: Binge drinking elevates the risk of accidents and injuries, particularly related to impaired judgment and coordination.

    Sociocultural Influences on Drinking Habits

    The escalation of binge drinking in certain countries can be attributed to various factors. These include but are not limited to:

    Cultural Acceptance

    In cultures where drinking is widely accepted and integrated into social activities, binge drinking becomes more common. Celebration rituals often involve alcohol, encouraging higher consumption rates. In contrast, societies with stricter attitudes toward drinking may see lower binge drinking prevalence.

    Availability of Alcohol

    Easily accessible alcohol can lead to increased consumption. In countries where alcohol is readily available, the temptation to binge can become overpowering, particularly during social gatherings or events.

    Economic Factors

    Socio-economic status impacts drinking habits as well. In regions where disposable income is higher, individuals may engage in binge drinking more readily. Conversely, lower economic status can correlate with alternatives to alcohol consumption.

    The Role of Policy and Education

    Tackling the issue of binge drinking necessitates a multi-faceted approach involving effective policy-making and educational initiatives. Strategies could include:

    • Awareness Campaigns: Educating the public about the risks associated with binge drinking can help shape healthier attitudes toward alcohol consumption.
    • Policy Regulation: Implementing stricter regulations on the sale and advertising of alcohol could deter binge drinking behavior, particularly among younger individuals.
    • Community Programs: Creating supportive environments that promote responsible drinking and provide resources for those struggling with alcohol dependency is crucial.

    As the statistics reveal, binge drinking remains a significant concern in many parts of the world. Understanding the cultural, social, and economic factors that contribute to this behavior is essential in addressing the associated health risks and crafting effective strategies for intervention.