Tag: U.S. dollars

  • 26% Tariff Hike Hits India’s $30B Gem Industry Hard

    26% Tariff Hike Hits India’s $30B Gem Industry Hard

    Impact of U.S. Tariffs on India’s Gem and Jewelry Industry

    In recent developments, U.S. President Donald Trump’s introduction of new tariffs has cast a shadow over India’s gemstone and jewelry industry. This sector, already facing challenges, could be adversely affected by these changes, influencing not only exports but also employment opportunities.

    The U.S. Market: A Crucial Player

    The United States stands as one of India’s largest markets for gemstones and jewelry. In the financial year 2024-25, it is estimated that approximately one-third of India’s total gem and jewelry exports will be directed towards the U.S. The industry has come to rely significantly on American consumers, making the current tariff situation particularly concerning.

    Rising Tariff Rates: A Game Changer

    Historically, the diamond and gems sector enjoyed zero tariffs when exporting to the U.S. However, the recent increase in duties, which has surged to 26 percent, substantially alters the landscape for exporters. This new rate isn’t isolated; it carries implications for other jewelry categories as well:

    • Gold and Platinum Jewelry: Previously subject to certain tariffs, these items will now see rates escalate to between 31% and 33%.
    • Silver Jewelry: Exporters can expect duties ranging from 31% to 39.5%, marking a steep climb in costs.
    • Imitation Jewelry: Similar trends are observed here, with tariffs elevating to between 26% and 37%.

    This blanket rise in tariffs presents challenges for Indian jewelers, who may struggle to remain competitive against domestic producers in the U.S. facing lower or non-existent tariffs.

    Challenges Beyond Tariffs

    The tariff increases come at a time when the diamond and gems industry is grappling with a host of other challenges. In particular, the sector has been hindered by a slowdown in demand:

    Declining Demand from China

    One of the contributing factors to the downturn is a noticeable reduction in demand from China, a key market for luxury goods. Economic challenges have impacted consumer spending, leading to a trend that has reverberated through the global market.

    Shift in Consumer Preferences

    In addition to external market pressures, there is a shift in consumer behavior that is also causing concern:

    • Lab-Made Diamonds: More consumers are gravitating towards affordable, lab-produced alternatives, which offers similar aesthetic value without the high price tag of natural diamonds.
    • Changing Marriage Trends: Falling marriage rates have coincided with reduced interest in traditional engagement rings, further dampening demand within the jewelry sector.

    Employment at Risk

    The interplay of increased tariffs and declining demand poses risks not only to profitability but also to employment within the industry. With reduced exports to one of its major markets, the gemstone sector may face layoffs and reduced job opportunities, putting many livelihoods at stake.

    Conclusion

    As the U.S. implements new tariffs affecting India’s gem and jewelry sector, the situation remains dynamic. The policy shift has implications that extend beyond immediate financial effects, potentially reshaping the industry’s landscape as it navigates newfound challenges. With evolving global market trends and changing consumer preferences, the future of India’s gem industry stands at a critical juncture.

  • Apple’s Q1 2025 Sees 46.9% Margin, Services Surge to 74%

    Apple’s Q1 2025 Sees 46.9% Margin, Services Surge to 74%

    Apple’s Record Profitability in Q1 2025: An In-Depth Analysis

    Apple Inc., a stalwart in the tech industry, continues to amaze investors and analysts alike with its impressive financial performance. As one of the most profitable companies worldwide, Apple achieved record margins for the first quarter of 2025, coinciding with the end of December 2024. This blog aims to dissect the factors contributing to Apple’s remarkable profitability, particularly focusing on the intriguing dynamics within its services segment.

    Overview of Financial Performance

    Record Margins and Gross Profits

    For the fiscal year 2024, Apple reported full-year gross profits exceeding $180 billion. Notably, the profit margin increased significantly to 46.2 percent, climbing even higher to 46.9 percent in Q1 2025. This surge in profitability is remarkable, especially considering that Apple’s core iPhone business faced challenges, and its operations in China were experiencing setbacks.

    The Impact of the Services Segment

    Despite the challenges faced in product sales, it is the burgeoning services segment that has consistently bolstered Apple’s profitability. This segment, which encompasses a variety of offerings including Apple Music, the App Store, Apple Care, iCloud, and licensing agreements, has demonstrated robust growth.

    The Services Segment: A Pillar of Profitability

    Rising Profitability Margins

    In 2024, Apple’s services segment reported staggering profitability margins of 74 percent. This figure represents a significant increase of 10 percentage points over a five-year span. The surge in services profitability demonstrates Apple’s strategic pivot towards a more service-oriented business model, enabling the company to maintain its financial health even amid product performance hurdles.

    Growing Services Portfolio

    The expansion of Apple’s services portfolio plays a crucial role in its financial success. Each service offered not only generates revenue but also fosters customer loyalty and increases the likelihood of continued engagement with the Apple ecosystem. As consumers become more reliant on services such as iCloud for storage, Apple Music for streaming, and the App Store for applications, the company secures recurring revenue streams that shield it from the volatility of product sales.

    Challenges in Product Sales

    Stagnant Gross Profit Margins in Products

    While Apple’s services segment shines brightly, the same cannot be said for its product sales. The gross profit margins for Apple’s hardware products stand at around 37 percent, reflecting a modest growth of just 5 percentage points since 2019. This stagnation highlights the difficulties Apple faces in the increasingly competitive tech landscape, particularly within mature product categories like smartphones and tablets.

    Declining Sales in Certain Categories

    Notably, sales figures for some product categories have either stagnated or begun to decline. This trend underscores the challenges Apple encounters in maintaining strong sales figures as the market matures and competition increases. Although the overall gross margins from sales showed some improvement in 2024 after a dip in 2023, the growth is not keeping pace with the trajectories established by the services segment.

    Strategic Implications

    Balancing Product and Services Growth

    Given the contrasting performances between its product and services segments, Apple is tasked with the challenge of balancing its portfolio. The company must continue to innovate within its product lines while simultaneously expanding its services offerings. By successfully navigatίαtng these dual paths, Apple can safeguard its leading industry position and maintain robust profitability.

    Future Outlook

    Apple’s commitment to enhancing its services segment while addressing stagnation in product sales will be critical in shaping its future. Continued investment in services is expected to pay dividends, particularly as more consumers lean towards subscription-based models and integrated services.

    The analysis of Apple’s fiscal performance in recent quarters illustrates a vital shift in the company’s financial strategy, driven significantly by the remarkable success of its services segment. As the technology landscape evolves, Apple’s ability to adapt and grow in both segments will determine its ongoing success.

  • Meta’s Capital Expenditure Jumps 130% to $65B by 2025

    Meta’s Capital Expenditure Jumps 130% to $65B by 2025

    Meta’s Record Capital Expenditure: An In-Depth Look

    Meta Platforms, Inc. has recently made headlines with its impressive financial performance and strategic direction, particularly in the realm of artificial intelligence (AI). With record capital expenditures reported for the fourth quarter of 2024 and the full year, let’s delve into the details of their investment strategy and what it means for the future of the company.

    Capital Expenditure Overview

    In Q4 of 2024, Meta reported capital expenditures amounting to $14.8 billion, contributing to a staggering $39.2 billion for the entire year. This marks a significant investment in the company’s infrastructure, particularly in technologies that support AI initiatives. Furthermore, for 2025, Meta’s projections indicate an increase in expenditures that could reach up to $65 billion, showcasing a remarkable anticipated jump of approximately 130 percent over two years.

    Competitive Landscape: A Broader Perspective

    Meta’s ambitious spending plans align with similar forecasts from other tech giants. Microsoft, for instance, has earmarked $80 billion for data centers and infrastructure development in the coming year. Amazon is also revising its spending figures upward, indicating that it will exceed an initial estimate of $75 billion for infrastructure-related investments. This trend underlines a growing commitment among leading tech companies to enhance their AI capabilities and infrastructure.

    Meta’s Strategic AI Investments

    While Meta’s ventures into virtual reality and the metaverse are widely recognized, the company is also making significant strides in the AI realm. Notable among its projects is Llama, an AI product characterized by its complete open-source approach. Unlike many competitors who adopt more traditional methods of monetization through licensing or subscriptions, Meta’s strategy with Llama focuses on collaboration and community-driven development.

    The Open-Source Advantage

    The open-source model utilized for Llama allows developers outside of Meta to contribute to its continuous improvement. This approach can lead to significant cost reductions, as the company benefits from innovations and expertise from the global developer community. Meta has introduced commercial licenses that enable other enterprises to integrate Llama into their applications, broadening its applicability while maintaining the foundational open-source nature.

    Implications of Open-Source AI

    Meta’s decision to adopt an open-source framework for Llama has several potential benefits:

    • Continuous Improvement: The contributions from external developers not only enhance Llama’s capability but also enable faster iterations and innovations.

    • Recruitment Opportunities: By fostering an open-source community, Meta can build relationships with top-tier talent. Developers who engage with Llama may eventually be drawn into Meta’s ecosystem, potentially leading to future employment opportunities.

    • Establishing Standards: By positioning Llama as an open-source standard in various fields, Meta could solidify its influence in the evolving AI landscape. This could pave the way for further advancements and integrations across multiple sectors.

    The Context of Competitive AI Developments

    As Meta forges its path in AI development, it faces competition from innovations like DeepSeek-R1, an AI solution touted for its cost-cutting capabilities. The rise of such technologies reinforces the urgency for tech companies to innovate and adapt in a fast-evolving market. Meta’s commitment to open-source AI can be seen as a strategic move to not only stay relevant but to lead in certain aspects of the AI domain.

    Future Projections and Strategic Direction

    As we look towards the future, Meta’s investment in AI infrastructure and open-source initiatives indicates a definitive shift in how leading tech companies are approaching development and innovation. The scale of their anticipated spending reflects both confidence in AI and the necessity to compete on a global stage, particularly with the rapid advancements seen in countries like China.

    Tech enthusiasts and industry watchers alike will be eager to see how Meta’s multifaceted strategy unfolds in the coming years, especially as the dynamics of AI technology continue to evolve rapidly.

  • Global Military Spending Doubles: 277% Increase in Asia

    Global Military Spending Doubles: 277% Increase in Asia

    The Surge of Global Military Spending Since the Early 1990s

    In recent years, the landscape of global military spending has undergone remarkable changes, with expenditures nearly doubling since the early 1990s. This substantial increase raises questions about the underlying motivations and implications for international relations, defense strategies, and global security.

    Historical Overview of Military Expenditure

    According to data from the SIPRI Military Expenditure Database, global military spending was approximately $1.3 trillion in 1993. Fast forward to 2023, and this figure surged to nearly $2.4 trillion. Such an increase indicates a significant shift in how nations prioritize defense and military readiness in an increasingly complex geopolitical environment.

    Growth Trajectories by Region

    Exploring military spending trends by region provides a clearer understanding of where the increases are most pronounced:

    • Asia and Oceania: This region has emerged as the leading driver of overall military expenditure growth, with an astonishing 277% rise in spending from 1993 to 2023. Factors contributing to this surge include rising tensions in the South China Sea, the North Korean threat, and strategic realignments in response to regional security challenges.

    • Africa and the Middle East: This area recorded a 154% increase in defense spending during the same time frame. The motivations behind this growth include ongoing conflicts, counter-terrorism efforts, and the need to build stronger military forces to maintain stability.

    • The Americas: Despite the overall doubling of military expenditure, the Americas remain the highest spending region, with total expenditures reaching $967 billion in 2023. The considerable budget reflects not only the military commitments of the United States but also a shift towards modernization of forces and new defense initiatives.

    • Europe: The data indicates that military spending in Europe has been steadily rising, primarily due to the ramifications of the ongoing war in Ukraine. This conflict has prompted nations to bolster their defense capabilities, resulting in heightened military budgets as a response to perceived threats.

    Key Players in Military Spending

    The distribution of military spending reveals the dominance of a few key players on the global defense stage:

    The United States

    The U.S. remains the largest military spender in 2023, with expenditures reaching $916 billion, accounting for 37% of global military spending. This significant investment reflects the country’s ongoing commitment to maintaining its military dominance and addressing emerging threats.

    China

    Following the U.S., China stands as the second-largest military spender, investing $296 billion in its defense efforts. This growth is attributed to China’s aspirations for greater regional influence, modernization of its armed forces, and enhancements in technological capabilities, particularly in areas such as cyber warfare and missile systems.

    Russia

    In the wake of geopolitical tensions, particularly regarding Ukraine, Russia invested $109 billion in its military in 2023. This marks a strategic focus on expanding capabilities and asserting its presence, underlining the impacts of regional conflicts on defense budgets.

    Other Notable Spenders

    • India: With a military budget of $83.6 billion, India ranks among the top five global military spenders, driven by threats from neighboring countries and a focus on defense modernization.
    • Saudi Arabia: Ranking fifth, Saudi Arabia’s military expenditure of $75.8 billion is primarily influenced by regional conflicts and the need to secure its borders against various threats.

    The Emergence of Ukraine

    Remarkably, Ukraine has positioned itself as the eighth-largest military spender globally in 2023, with a defense budget of $64.8 billion. This dramatic increase emphasizes the urgent need for military capabilities resulting from the ongoing conflict with Russia, showcasing how war can dramatically reshape a nation’s defense spending priorities.

    Implications of Rising Military Expenditure

    The near doubling of global military spending since the early 90s signals potentially transformative implications for both domestic and international politics. The increased budgets reflect not only national security concerns but also the complexities of global power dynamics, alliances, and potential conflicts.

    Conclusion

    The upward trajectory of military spending reflects deep-rooted issues concerning national security, geopolitical stability, and the global balance of power. As nations continue to adjust their strategic approaches, the implications ripple across borders, influencing everything from diplomacy to trade and international conflict resolution.

  • Indian Rupee Hits Record Low: 1 Rupee = 1.18 USD

    Indian Rupee Hits Record Low: 1 Rupee = 1.18 USD

    The Decline of the Indian Rupee: A Detailed Overview

    The Indian rupee has recently been on a troubling trajectory, hitting a lifetime low against the U.S. dollar and raising concerns among economists, policymakers, and the general public. This blog delves into the factors that have contributed to this significant decline, shedding light on the broader implications for the Indian economy.

    Understanding the Exchange Rate Dynamics

    Current Exchange Rate Scenario

    As of early December 2024, the Indian rupee has plummeted to an exchange rate of 1 rupee to 1.18 U.S. dollars. This historic low represents a worrying trend that has emerged since mid-September of the same year. The challenges associated with currency valuation are exacerbated by various external and internal factors, creating a complex landscape for the Indian economy.

    Factors Affecting the Rupee’s Value

    • Political Climate in the U.S.: The recent U.S. elections have introduced an element of uncertainty in the global markets. President-elect Donald Trump’s policies, including threats of imposing 100 percent tariffs on BRICS nations, have created apprehensions among international investors regarding the future stability of currencies like the Indian rupee.

    • Foreign Fund Outflows: Another critical aspect impacting the rupee’s value is the persistent outflow of foreign funds from Indian markets. Investors are signaling caution, turning their attention to more stable markets, which has resulted in reduced demand for the rupee.

    • Demand for the Greenback: A renewed demand for the U.S. dollar has further contributed to the rupee’s depreciation. As global investors flock to the dollar as a safe haven, emerging market currencies, including the rupee, face downward pressure.

    Macro Economic Indicators

    GDP Growth Concerns

    The economic landscape in India has been equally troubling, as evidenced by the decline in the country’s GDP growth. Experts had predicted a year-over-year growth range of 6.5 to 6.8 percent for the third quarter of 2024; however, India’s economy only managed to grow by 5.4 percent compared to the same quarter in the preceding year. This significant deviation from expectations signals underlying weaknesses in the economy.

    Sectors Impacted

    • Manufacturing and Utilities: The slowdown in GDP growth can be largely attributed to decreased output in crucial sectors such as manufacturing and utilities. These sectors are vital for economic expansion and their underperformance can have far-reaching consequences.

    • Urban Consumption Trends: Lower urban consumption has also emerged as a significant concern. The decrease in consumer spending in urban areas indicates shifting consumer confidence and may suggest that households are tightening their budgets in light of economic uncertainty.

    The Broader Implications of the Rupee’s Decline

    Inflationary Pressures

    A depreciating rupee often leads to inflationary pressures, as the cost of imported goods rises. This can affect everything from fuel prices to everyday consumer products, creating a ripple effect that can impact living standards for ordinary citizens.

    Impact on Trade Balance

    The falling value of the rupee may also complicate India’s trade balance. While a weaker currency can make exports cheaper and more competitive internationally, it can simultaneously make imports more expensive. This dual effect can strain the economy, especially for a country that relies heavily on imported raw materials and technology.

    Investment Sentiment

    Finally, the declining rupee may deter foreign investment in India. The perception of risk associated with currency volatility could lead potential investors to reconsider their strategies, resulting in a slowdown of foreign direct investment (FDI) flows into the country.

    Conclusion

    The current economic climate in India, characterized by a depreciating rupee, sluggish GDP growth, and sectoral challenges, poses significant hurdles for the nation. While the dynamics of currency exchange are influenced by a multitude of factors, understanding the nuances of these changes is essential for both policymakers and citizens alike. As the country navigates this turbulent period, the ramifications of these developments on India’s economic future remain to be seen.

  • Ukraine Aid Projections: Up to $119B or Down $59B by 2025?

    Ukraine Aid Projections: Up to $119B or Down $59B by 2025?

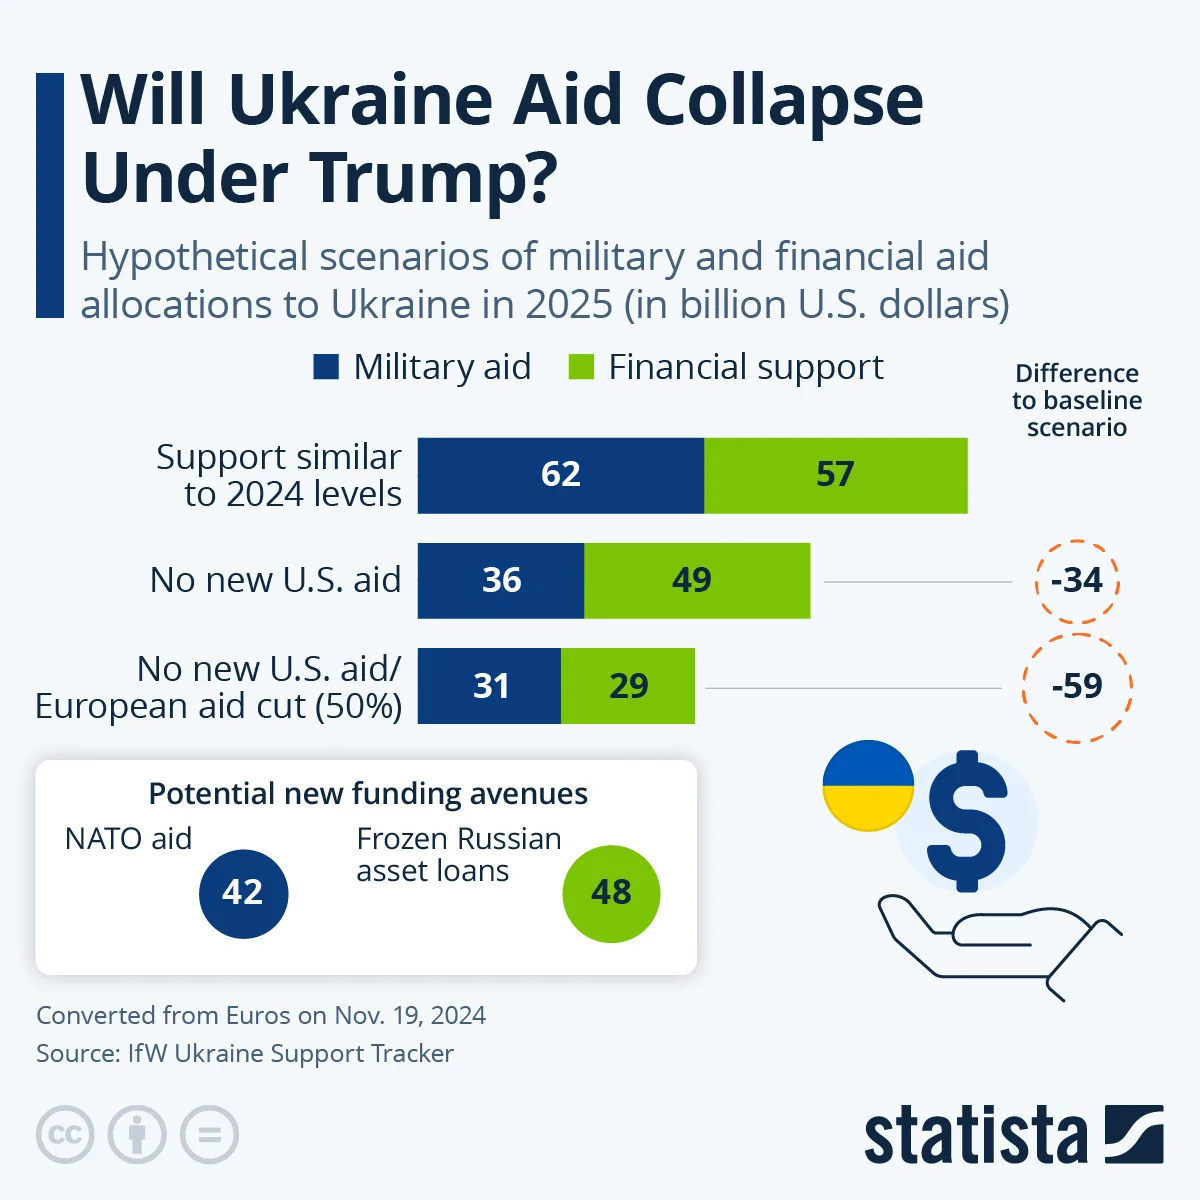
    Will Ukraine Aid Collapse Under Trump? Understanding the Political Implications for 2025

    The ongoing conflict in Ukraine has necessitated significant international support, primarily from the United States and its allies. As the 2024 presidential election in the U.S. approaches, concerns about the future of aid to Ukraine have risen, particularly with Donald Trump’s candidacy and his past rhetoric regarding U.S. military commitments abroad. This blog delves into the implications of potential shifts in Ukraine aid under a Trump presidency and contemplates different funding scenarios for 2025.

    The Context of U.S. Aid to Ukraine

    Since the onset of the Ukrainian conflict, which escalated markedly in 2022, the United States has emerged as one of Ukraine’s main allies, providing substantial military and financial assistance. This aid aligns with the Biden administration’s strategy to support democratic nations against authoritarian aggression. However, Trump’s previous criticisms of overseas military engagements raise questions about whether this support can be sustained or will take a different form if he regains presidency.

    Hypothetical Scenarios for Ukraine Aid in 2025

    Researchers at the Kiel Institute for the World Economy have presented several hypothetical scenarios for what Ukraine might expect in terms of aid by the year 2025, assuming Trump returns to office. These scenarios are crucial for understanding the possible trajectories of international support.

    Continued Aid Trends

    The baseline scenario posits that if aid levels continue on their current trajectory through 2024, Ukraine could receive around $119 billion in 2025. This scenario assumes steady commitments from both the U.S. and European allies, creating a stable support framework for Ukraine.

    A Complete Cut of U.S. Aid

    On the other hand, a scenario where Trump cuts all U.S. aid could lead to a drastic reduction in funding, dropping it down to approximately $85 billion in 2025. This represents a staggering shortfall of $34 billion relative to the baseline scenario. Such a cut would not only impact military operations but also Ukraine’s broader economic recovery efforts.

    The Ripple Effect: European Aid in Flux

    Moreover, if the U.S. aid were to be significantly reduced or completely halted, European nations might follow suit, contingent upon their reliance on U.S. leadership for foreign policy direction. The Kiel Institute researchers have explored the implications of this potential scenario, suggesting that European aid could drop by 50 percent, resulting in an estimated gap of $59 billion compared to levels established in 2024.

    Emerging Funding Solutions for Ukraine

    In light of these uncertain scenarios, it’s also important to consider new funding channels that have been proposed to bolster Ukraine’s efforts and potentially offset any reductions in U.S. support.

    NATO’s Pledges

    NATO has recently committed to coordinated aid totaling $42 billion for Ukraine in 2025. This pledge represents a collective security strategy that not only addresses Ukraine’s immediate needs but also strengthens the alliance’s deterrent capabilities against further aggression.

    G7 Financing Initiatives

    Additionally, the G7 has outlined a plan to provide $48 billion in loans to Ukraine, capitalizing on frozen Russian central bank assets. This initiative showcases an innovative approach to funding, potentially allowing Ukraine to access funds without exacerbating foreign debt levels.

    The Need for Increased Support

    Despite these pledges, experts argue that merely maintaining the current levels of aid may not be sufficient. The situation calls for a strategic shift where support is not only sustained but possibly increased to ensure that Ukraine can achieve a decisive victory against the ongoing threats posed by Russian aggression.

    In a rapidly changing geopolitical landscape, the dynamics surrounding Ukraine aid are intertwined with U.S. domestic politics and international policymaking. As we look toward the future, the fate of Ukraine’s aid and its broader implications will undoubtedly continue to evolve, contingent on the political climate and the strategic decisions made at both domestic and international levels.