الوسم: Country Income Group

  • 38% of Girls in Low-Income Nations Complete Lower Secondary School

    38% of Girls in Low-Income Nations Complete Lower Secondary School

    The Gender Education Gap: A Closer Look at Low-Income Nations

    The journey toward gender equality in education has made significant strides over the past few decades, particularly in lower middle-income nations. However, the progress remains uneven, especially in low-income countries where girls continue to face substantial barriers to education. This blog explores the persistent education gender gap in low-income nations, examining the statistics, challenges, and underlying factors influencing this disparity.

    Current Statistics on Education Gender Gap

    As of 2021, only 38 percent of girls in low-income regions, primarily in Africa, completed lower secondary school. In contrast, 43 percent of boys reached this educational milestone, resulting in a gender ratio of approximately 0.89 girls for every boy. This stark statistic highlights the ongoing challenges faced by girls in accessing and completing their education, particularly in the most impoverished areas of the world.

    Historical Context: Progress in Different Income Groups

    The narrative of educational attainment is not static; it has evolved significantly over the decades. In the mid-1980s, the gender education gap was quite similar across low-income and lower-middle-income countries, with a ratio of approximately 0.65 females for every male. By the early 2010s, many of these nations had achieved gender parity in education. In upper middle-income countries, like those in Latin America, China, and South Africa, this equity was attained even earlier, as early as 2004.

    The Role of Socioeconomic Factors

    Poverty: A Significant Barrier

    The World Bank highlights several confounding factors that contribute to the gender education gap. Poverty ranks as a predominant challenge, severely limiting access to educational resources. Families struggling to meet basic needs may prioritize their limited resources towards sons over daughters, perpetuating the cycle of inequality.

    Geographic Isolation

    Another factor impacting educational access is geographic isolation. In rural or remote areas, the availability of schools, transportation, and learning materials can be severely restricted, often pushing girls deeper into educational disenfranchisement.

    Minority and Disability Status

    Minority or disabled status can further complicate a girl’s educational journey. Stigmas, systemic biases, and lack of appropriate accommodations mean that many girls from these backgrounds are likely to encounter significant barriers in their pursuit of education.

    Academic Performance: Girls vs. Boys

    Despite the barriers they face, research shows that girls often outperform boys in numerous educational metrics. For instance, girls tend to excel in reading proficiency by the end of primary school and have a higher likelihood of pursuing tertiary education. This paradox highlights that while girls may demonstrate strong academic capabilities, systemic issues prevent them from fully capitalizing on these strengths.

    Global Trends in Education Ratios

    According to data from 2023, about 88-89 percent of children in relevant age groups completed primary school globally, indicating significant progress. However, the data reveals an alarming trend: girls remain overrepresented among children who are never enrolled in school. Moreover, while around 75 percent of all children finished lower secondary school, the data reflects stark disparities in specific countries.

    Case Study: Afghanistan

    In Afghanistan, the gender gap in educational attainment is striking, with boys surpassing girls in access to education by over 30 percentage points for 8th-grade completion. This case exemplifies how cultural, political, and infrastructural factors converge to create obstacles for girls’ education, further entrenching social inequalities within the country.

    Conclusion

    [This section will not be included as per your request.]
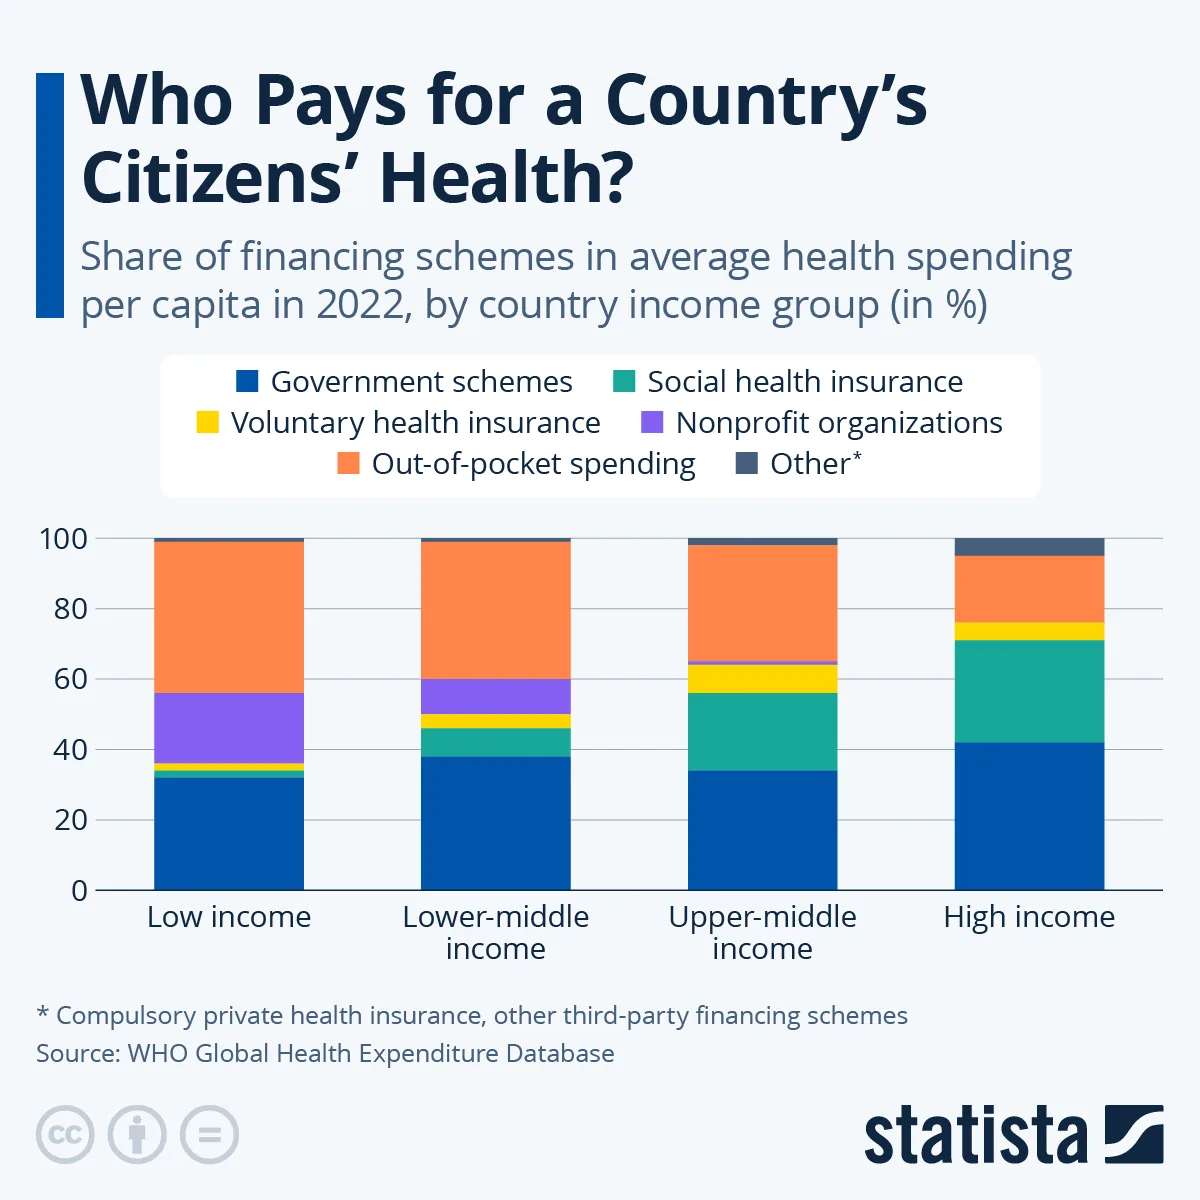
  • 43% of Health Spending is Out-of-Pocket in Low-Income Nations

    43% of Health Spending is Out-of-Pocket in Low-Income Nations

    Understanding Global Healthcare Spending: A Closer Look at Out-of-Pocket Expenses

    In an era where healthcare continues to be a pressing concern globally, understanding the distribution of health expenditures is critical. Recent findings from the 2024 Global Spending on Health report by the World Health Organization (WHO) provide valuable insights into how different income groups manage healthcare costs.

    The Impact of Income on Healthcare Spending

    Out-of-Pocket Expenses Across Income Levels

    One of the most striking revelations from the WHO report is the stark contrast in out-of-pocket spending across income levels. In low-income countries, 43% of all health spending is made up of out-of-pocket expenses. This means that individuals are directly responsible for a large portion of their healthcare costs, which can lead to significant financial strain. In comparison, high-income countries see this figure drop dramatically to just 19%.

    Access to Quality Healthcare

    The reliance on out-of-pocket spending often translates to varying quality of healthcare across different regions. In low-income countries, the high percentage of personal spending could result in individuals forgoing necessary medical treatments due to financial constraints. During economic downturns, this burden exacerbates access issues, with many unable to afford even basic medical services.

    Sources of Healthcare Funding

    Government Schemes and Social Health Insurance

    In contrast to out-of-pocket spending, government schemes play a pivotal role in the healthcare financing structure of low and middle-income countries. These schemes often require little to no financial contribution from beneficiaries, ensuring that healthcare is more accessible.

    Additionally, social health insurance systems, which are more prevalent in upper-middle and high-income countries, contribute greatly to overall health spending. In countries like Germany and France, for example, employees fund their health insurance through salary deductions, while employers contribute financially as well. This shared responsibility helps alleviate the burden on individuals, promoting greater access to healthcare services.

    The Role of Voluntary Private Health Insurance

    While voluntary private health insurance exists, its share in the overall healthcare spending is relatively minor. In upper-middle-income countries, for instance, it constitutes only about 8% of total health expenditures. This suggests that most people still rely on public systems and government support rather than private insurance schemes.

    A Global Perspective on Health Expenditures

    The Total Cost of Global Health

    The total estimated health expenditures worldwide reached a staggering $9.8 trillion in 2022. This figure has more than doubled since the year 2000, indicating a significant rise in global healthcare costs. Of this total, domestic public spending amounted to $6.1 trillion, making up 62% of global health expenditures. This funding primarily comes from domestic sources, including general taxation and social health insurance contributions.

    The United States: A Major Player in Global Health Spending

    The United States is a standout contributor to global health expenditures, accounting for a remarkable 43% of the total health spending worldwide. Other high-income nations, including Japan, France, Germany, and the United Kingdom, collectively make up an additional 36%. In stark contrast, low and lower-middle-income countries only contribute around 3% of the global health expenditure.

    Income Group Classifications by the World Bank

    Understanding Upper-Middle-Income Countries

    The World Bank classifies countries based on their gross national income per capita, creating distinctions that help contextualize healthcare spending. The upper-middle-income group includes nations such as Montenegro, Belarus, Namibia, Turkey, and Peru, with a per capita income ranging from $4,516 to $14,005. This classification is significant as it influences how these countries structure their healthcare funding and the accessibility of services to their populations.

    Future Implications for Healthcare Policy

    As countries navigate the complexities of healthcare financing, the findings from the WHO report highlight essential considerations for policymakers. Understanding the implications of out-of-pocket spending and the disparities between income groups can inform strategies aimed at improving healthcare access, enhancing quality of care, and developing sustainable health systems that benefit all citizens, regardless of their economic status.