Tag: 2022

  • U.S. Naturalizations at 3 per 1,000, Aligned with Europe

    U.S. Naturalizations at 3 per 1,000, Aligned with Europe

    Examining Naturalization Trends: U.S. and Europe Compared

    The process of naturalization remains a defining aspect of immigration policy around the world. Understanding how different nations approach this process can shed light on broader social dynamics and demographic trends. Recent data from the OECD highlights some interesting parallels and contrasts between the United States and its European counterparts in regard to naturalization rates.

    Naturalization Rates in Birthright Citizenship Countries

    In countries where birthright citizenship is practiced, the naturalization statistics can vary significantly. The U.S. boasts a rate of 3 naturalizations per 1,000 residents, placing it alongside several European nations such as Spain, the Netherlands, Italy, the United Kingdom, and Germany. This finding is striking considering that the U.S. is unique in its approach to citizenship, often simplifying the path to citizenship through birthright.

    A Global Perspective

    The highest naturalization rate among OECD countries is found in Canada, with a remarkable 9.6 naturalizations per 1,000 residents. Conversely, Mexico stands at the low end of the spectrum, with only 0.01 naturalizations per 1,000 residents in 2022. This vast range indicates significant differences in policies, public attitudes, and the demographic makeup of these countries.

    European Comparisons

    While the U.S. maintains a competitive naturalization rate, some Scandinavian nations actually surpass it. Countries like Sweden and Norway have made naturalization processes accessible and appealing, leading to higher rates of successful applications. On the other hand, countries such as France and several Eastern European nations display lower naturalization rates, reflecting varying national policies and attitudes towards immigrants.

    Luxembourg: The Outlier

    Luxembourg presents an intriguing case within Europe, achieving an astounding rate of 16 naturalizations per 1,000 residents in 2022. This small nation has a particularly high percentage of foreign-born residents, exceeding 50%. The dynamics in Luxembourg highlight how demographic composition can influence naturalization rates, often leading to policies that accommodate and integrate immigrant populations more effectively.

    Factors Influencing Naturalization Rates

    The differences in naturalization rates across nations can be attributed to several factors:

    • Policy Framework: The regulations surrounding naturalization, including residency requirements and testing, can play a significant role in shaping rates.

    • Public Sentiment: The societal attitudes toward immigrants and policies can greatly affect how welcoming a nation is toward newcomers seeking citizenship.

    • Demographic Composition: Nations with higher proportions of foreign-born residents may naturally have higher naturalization rates, as they reflect the integration of these individuals into the society.

    Implications for Immigration Policy

    The insights gleaned from these naturalization statistics contribute to a broader conversation about immigration policy, integration, and national identity. As countries navigate these complexities, understanding the experiences of different populations can guide more effective and humane policies. The similarities observed between the U.S. and Europe challenge assumptions about citizenship and encourage further examination of what it means to be a member of a nation in today’s globalized world.

  • 54% of Teens & 45% of Adults Face Mental Health Treatment Barriers

    54% of Teens & 45% of Adults Face Mental Health Treatment Barriers

    Mental Health Awareness Month: Turning Awareness into Action

    Mental Health Awareness Month, observed in May, is a vital time to emphasize not only the recognition of mental health issues but also the necessity for tangible changes in the way these issues are treated. The 2025 theme, "Turn Awareness into Action," particularly highlights the importance of progressing from mere recognition to meaningful engagement with mental health support and treatment.

    Current Landscape of Mental Health Treatment

    Recent data from Mental Health America reveals striking statistics regarding mental health treatment accessibility in the United States. In 2023, the figures showed that while a significant number of adults and teenagers with mental health needs recognized their issues, the treatment they received was limited. Specifically, between 45% and 58% of individuals within these groups were able to access necessary treatment, indicating a substantial gap in mental healthcare delivery.

    Age-Based Disparities in Treatment

    A closer examination of these statistics reveals notable differences in the reasons for unmet mental health needs across age groups.

    Adults vs. Teenagers

    For adults, common barriers include:

    • Cost of Treatment: A large number indicated that financial constraints prevented them from seeking help. Many adults reported that their insurance either did not cover adequate costs or that out-of-pocket expenses were too high.

    • Self-Reliance: Another significant reason adults cited was a belief that they could handle their mental health challenges on their own, reflecting a cultural mindset that often stigmatizes seeking help.

    In contrast, teenagers aged 12 to 17 faced different obstacles:

    • Fear of Judgment: This age group expressed heightened concerns about being judged if they sought help, pointing to the lingering stigma attached to mental health, particularly among younger individuals.

    • Confidentiality Concerns: Many teenagers were apprehensive about their privacy, highlighting a crucial need for more open and supportive discussions around mental health within schools and communities.

    Awareness of Support Services

    An alarming statistic shows that 38% of adults and 56% of teenagers reported not knowing where to find the support services they needed. This lack of awareness adds another layer of complexity to the existing issues surrounding mental health treatment.

    Importance of Education

    Improving mental health literacy can play a fundamental role in addressing this gap. By educating both adults and teenagers about available resources and services, communities can reduce the stigma and barriers currently hindering access to treatment. Schools, local organizations, and healthcare providers must collaborate to ensure that individuals know where to seek help.

    Moving Forward: From Recognition to Action

    As we progress through Mental Health Awareness Month and beyond, it’s essential to convert increased awareness into actionable steps. This involves not only enhancing access to mental health services but also fostering environments where individuals feel safe and supported in discussing and addressing their mental health needs.

    By focusing on both prevention and treatment, communities can work towards a society where mental health is prioritized just as much as physical health, paving the way for improved overall well-being.

  • Taylor Swift: Five-time World’s No. 1 Recording Artist Champion

    Taylor Swift: Five-time World’s No. 1 Recording Artist Champion

    Taylor Swift: A Historic Year in Music

    In 2024, Taylor Swift again proved her dominance in the music industry. Her remarkable achievements have not only solidified her position as a global superstar, but they also showcase her extraordinary influence in the ever-evolving landscape of music.

    The Most-Streamed Artist

    Taylor Swift’s reign continued as she emerged as the most-streamed artist across major platforms like Spotify and Apple Music. This accolade is particularly noteworthy, as it reflects her widespread appeal and the deep connection she has established with listeners around the world. In a digital era where streaming metrics are a critical measure of success, Swift’s position at the top is a testament to her ability to resonate with fans, captivate new audiences, and adapt her music style to fit the changing tastes of the industry.

    Record-Breaking Album Sales

    Apart from her streaming successes, Swift also held the title for the best-selling album in the United States. This achievement is significant given the current challenges faced by the music industry related to physical sales versus digital streaming. Swift’s ability to release an album that not only garners critical acclaim but also resonates with her audience enough to lead to substantial sales demonstrates her artistry and marketing genius.

    The "Eras Tour" Phenomenon

    One of Swift’s most remarkable accomplishments in 2024 was her "Eras Tour," which shattered records by becoming the first concert tour to gross over $2 billion. The tour not only delighted fans with a comprehensive showcase of her musical evolution but also served as a cultural phenomenon that brought communities together, celebrating the various chapters of her career. This tour is a brilliant example of how an artist can transcend the music scene and become a part of social conversations, driving a deeper connection with her fan base.

    Recognition by the IFPI

    The International Federation of the Phonographic Industry (IFPI) took notice of Taylor Swift’s incredible year, announcing her as the biggest-selling recording artist in the world for the fifth time. This accolade highlights her remarkable consistency and the universal appeal of her music.

    A Statement from IFPI’s CEO

    Victoria Oakley, the CEO of the IFPI, expressed her pride in awarding Swift this recognition once again. She emphasized how Swift not only continues to be a leading figure in the music industry but also redefines global success. This statement underscores the transformative effect Swift has had, both in terms of music sales and her relationship with her audience.

    A Shift in the Artist Landscape

    Taylor Swift’s consistent presence at the top of the charts for three consecutive years marks a shift in the artist landscape. After being second to K-Pop group BTS in 2021, Swift’s current position underscores a significant evolution in the industry, especially with BTS’s hiatus due to military service.

    Other Noteworthy K-Pop Acts

    Despite BTS’s absence from the top ranks, other K-Pop acts like SEVENTEEN and Stray Kids have risen, cementing their places among the world’s best-selling artists. The growth of K-Pop reflects the genre’s expanding influence and popularity around the globe, introducing a diversified sound and fan culture that enriches the global music scene.

    Rising Stars

    In addition to established artists like Drake and The Weeknd, who also maintained their rankings, new contenders are emerging. Zach Bryan, a country music sensation, made remarkable strides, jumping from 16th to 6th place in the rankings. His ascent speaks volumes about the shifting dynamics within the music industry and the increasing acceptance and recognition of diverse genres.

    A Lasting Impact

    Taylor Swift’s achievements in 2024 highlight an important era in the music industry— one where artists are not only measured by their sales and streams but also by their ability to connect with their audience on multiple levels. As the parameters for success continue to evolve, Swift’s name will surely dominate conversations about the future of music for years to come.

  • Asian Undocumented Immigrants: 733 Indians and 264 Chinese Deported

    Asian Undocumented Immigrants: 733 Indians and 264 Chinese Deported

    Understanding Undocumented Immigration in the United States

    Overview of Undocumented Immigrants in the U.S.

    The landscape of undocumented immigration in the United States has been a focal point of political debate and policy-making, especially in recent years. As of 2022, an estimated 11 million undocumented immigrants reside in the U.S., with significant populations originating from various countries. Among these nationals, residents from India and China stand out as some of the most populous groups, underscoring a complex narrative surrounding immigration patterns and enforcement.

    Key Statistics on Undocumented Immigrants

    According to data from the Pew Research Center, Indian and Chinese nationals account for substantial segments of the undocumented immigrant population in the U.S. Specifically, in 2022, the estimated numbers were:

    • Indian immigrants: Approximately 725,000
    • Chinese immigrants: Approximately 375,000

    While these figures place them among the top six nationalities for undocumented residents, they seldom appear in deportation statistics, raising questions about the factors influencing immigration enforcement.

    Deportation Trends and Arrest Statistics

    Despite the significant numbers of undocumented immigrants from India and China, deportation statistics tell a different story. In 2022, only a fraction of this population faced deportation:

    • Indians deported: 733
    • Chinese deported: 264

    These numbers position Indian and Chinese nationals at ranks 13 and 19, respectively, in terms of deportations, which is markedly lower given their undocumented population sizes. This discrepancy highlights the complexities involved in immigration enforcement in the U.S.

    Factors Influencing Deportation Rates

    Geographic Concentration

    One notable factor impacting deportation rates is the geographic concentration of different immigrant groups. The majority of deportations are heavily skewed towards nationals from Mexico and Central America. This can be attributed to:

    • Geographic proximity: Many migrants from these regions cross the U.S.-Mexico border, making them more susceptible to detection and deportation by agencies such as Customs and Border Protection (CBP) and the Immigration and Customs Enforcement (ICE).

    • Method of Entry: A significant number of undocumented individuals from further afield enter the U.S. through overstayed visas rather than crossing the border illegally. This difference in entry methods makes them less likely to encounter immediate deportation measures.

    Policy Implications

    The Trump Administration’s Deportation Goals

    During the Trump administration, ambitions to increase deportation numbers culminated in the target of deporting 1 million individuals by 2025. However, as the administration grappled with lagging progress early on, it faced challenges—including the perception that deportation enforcement was disproportionately targeting specific populations.

    The policy shift towards broader enforcement across the entire country, as opposed to strictly at the southern border, could potentially align deportation efforts more closely with the demographic realities of undocumented residents.

    The Future of Immigration Enforcement

    Changing Focus of Deportation Practices

    As immigration policy continues to evolve, the focus on deportation practices may broaden. With adjustments to current policies and enforcement strategies, there may be a move toward addressing the undocumented populations residing in regions far from the southern border. Such changes could lead to:

    • Increased operational costs: Engaging in deportation efforts for individuals from countries like India and China could significantly increase logistical expenses due to longer travel distances for repatriation flights.

    • Engagement with multiple governments: As deportations expand to include more countries, U.S. officials will face the complexity of diplomatic relations and negotiations with various governments in facilitating these processes.

    This evolving narrative around undocumented immigrants offers a glimpse into the multifaceted and often contentious dynamics that shape immigration policy and enforcement in the United States. Through continual observation and analysis, more insights will emerge about how these policies affect the lives of millions of individuals and families navigating the complexities of undocumented status in America.

  • Ukraine Leads 2023’s Fastest Shrinking Populations: -0.2%

    Ukraine Leads 2023’s Fastest Shrinking Populations: -0.2%

    Countries Losing Population Fastest in 2023

    In the landscape of global demographics, some countries are witnessing a precipitous decline in their populations. This blog post will delve into the factors contributing to this phenomenon by focusing on countries that are losing their populations the fastest in 2023.

    The Impact of Conflict on Population

    Ukraine: The Fastest Shrinking Nation

    As of 2023, Ukraine has emerged as the nation with the most significant population decline, primarily due to the ongoing conflict instigated by the Russian invasion. The war has spurred a massive exodus of citizens seeking refuge from violence and instability. This situation underlines a critical aspect of demographic changes: conflict can not only lead to immediate casualties but also create a ripple effect, forcing people to flee their homes, destabilizing communities, and altering the nation’s demographics.

    Economic Factors and Stagnation

    Europe’s Overall Decline

    In 2023, Europe is the only continent experiencing a population decline, with a 0.2 percent reduction compared to the previous year. The United Nations Population Division has noted that this decline has been ongoing since 2021. Among the ten countries facing the sharpest population decreases, six hail from Europe. Countries such as Greece, San Marino, Belarus, Bosnia and Herzegovina, Albania, and Kosovo are significant representatives of this demographic trend.

    The Role of Birth Rates and Aging Populations

    Greece: A Looming Demographic Crisis

    Positioned third on the list of the fastest shrinking nations, Greece faces a worrying demographic outlook. According to national statistics, the country could witness a population collapse, with a projected loss of 1 million residents by 2050. Currently home to about 10 million people, Greece is grappling with a birth rate that plummeted by 30 percent between 2011 and 2021. The combination of socio-economic turmoil, exacerbated by the financial crisis of the 2010s and subsequent austerity measures, has dissuaded young people from starting families or prompted them to seek opportunities abroad.

    The Aftermath of Political Turmoil

    The Balkans: A Legacy of Conflict

    The demographic landscape in the Balkans is similarly affected. Countries like Bosnia, Kosovo, and Albania still bear the scars of conflict following the collapse of communism and the violent wars of the early 1990s. These nations have witnessed a significant outflow of citizens, fostering large diasporas that continue to impact local age structures and economies. The consistent emigration reflects not just the desire for better opportunities elsewhere, but also deep-rooted socio-economic challenges plaguing these nations.

    Environmental Challenges and Isolation

    Tuvalu: The Cost of Climate Change

    Ranked as the second-fastest shrinking country in the world in 2023, Tuvalu presents a unique case in this narrative. With a population of just around 10,000 people, this Pacific island nation is facing the dual challenges of economic limitations and extreme isolation. However, climate change exacerbates the situation, with rising sea levels threatening to render Tuvalu uninhabitable. The urgency of this crisis was highlighted during a prominent speech in 2021 when the foreign minister stood in knee-deep water, symbolizing the nation’s desperate plight.

    The Broader Implications of Population Decline

    The trends observed in these countries underline a significant narrative concerning global demographics. While conflict, economic stagnation, and environmental challenges are immediate factors, the broader implications for governance, social services, and economic viability cannot be overlooked. Nations grappling with these issues must find strategies to address the causes of population decline, focusing on enhancing economic opportunities, stabilizing regions affected by conflict, and factoring in environmental sustainability.

    The data concerning fast-shrinking nations paints a complex picture of global demographic changes; understanding this landscape is essential for policymakers and society as a whole in navigating the implications of these trends.

  • Nearly 7 Million Ukrainian Refugees Displaced Worldwide

    Nearly 7 Million Ukrainian Refugees Displaced Worldwide

    An Ongoing Crisis: The Ukrainian Refugee Situation

    Introduction to the Ukrainian Refugee Crisis

    In the wake of the ongoing conflict in Ukraine, nearly 7 million Ukrainians have fled their homeland, creating one of the most significant refugee crises in recent history. This unprecedented crisis has garnered international attention as countries around the globe grapple with the influx of displaced individuals seeking safety and stability.

    Current Statistics on Ukrainian Refugees

    According to data from the United Nations High Commissioner for Refugees (UNHCR), as of now, almost 7 million refugees from Ukraine have been registered in various countries worldwide. This staggering figure reflects the urgent need for humanitarian assistance and support.

    Main Destinations for Ukrainian Refugees

    Germany: The Leading Host Nation

    Germany has emerged as the primary destination for Ukrainians fleeing the war, hosting over 1 million refugees. The German government, along with numerous NGOs, has provided essential services, including housing, healthcare, and legal assistance, to help these individuals adjust to their new environment.

    Other Key Host Countries

    Following Germany, Russia and Poland have also seen significant numbers of Ukrainian refugees. Both nations have recorded more than 1 million registrations. The Czech Republic closely follows them, having also taken in a substantial number of displaced individuals.

    • Poland: The neighbor country to Ukraine continues to play a critical role in providing refuge, with just under 1 million Ukrainian arrivals.
    • Czech Republic: A favored destination due to shared borders and cultural ties, the Czech Republic has successfully hosted a considerable population of Ukrainian refugees.

    Internal Displacement Within Ukraine

    The conflict has not only led to international displacement but has also resulted in internal migration. Approximately 3.7 million Ukrainians have been internally displaced within their country, highlighting the pervasive impact of the war even on those who have not crossed international borders.

    Return Trends and Current Challenges

    Recent surveys reveal a complex picture regarding the return of Ukrainian refugees. Though over 1 million individuals are estimated to have returned to Ukraine, this trend has noticeably declined. Reports indicate that only 9 percent of refugees expressed intentions to return in 2024, signaling a growing concern over safety and living conditions in their home country.

    Many have faced challenges upon returning and have been forced to leave again, reflecting the ongoing volatility in the region. The decision to return is complicated by a lack of security and adequate resources in many areas affected by the conflict.

    Demographics of Ukrainian Refugees

    Understanding the demographics of Ukrainian refugees provides insight into the social fabric of this crisis:

    • Gender Distribution: Approximately 59 percent of the registered refugees are female, while 41 percent are male.
    • Children Affected: A significant portion, about 31 percent, are children, underscoring the humanitarian ramifications of the conflict on younger populations.
    • Elderly Refugees: Additionally, 6 percent of the refugees are aged 65 years or older, raising concerns about their specific needs and vulnerabilities.

    Spread Across Europe and Beyond

    Ukrainians have sought asylum in various other countries beyond the primary destinations. Noteworthy examples include:

    • United Kingdom: More than 200,000 Ukrainian refugees have settled in the UK, benefiting from various support programs designed to assist newcomers.
    • Spain: Spain has also welcomed over 200,000 refugees, providing a supportive environment and integration resources.

    Refugees in Other European Countries

    Additional countries that have contributed to hosting Ukrainian refugees include:

    • Romania, Italy, and Slovenia: These nations have registered between 130,000 and 180,000 Ukrainian refugees, playing a vital part in the European response to the crisis.

    Conclusion: The Humanitarian Response

    The humanitarian response to the Ukrainian refugee crisis remains ongoing, as countries continue to adapt their policies and programs to meet the needs of millions displaced by conflict. Authorities and organizations work tirelessly to ensure that those fleeing war have access to safety, shelter, and essential services.

  • 2022: 261.3 Cancer Cases per 100k in Wealthy Nations

    2022: 261.3 Cancer Cases per 100k in Wealthy Nations

    Understanding the Global Cancer Burden: The Impact of Development and Diagnosis

    Cancer remains one of the foremost health challenges globally, with its burden varying significantly across different countries and regions. Recent data from the WHO International Agency for Research on Cancer has shed light on how the cancer burden, specifically age-adjusted rates of incidence and mortality, are disproportionately higher in developed nations, particularly in North America and Oceania. This unique insight calls for a closer examination of the factors contributing to these troubling statistics.

    Age-Adjusted Cancer Rates: A Clear Perspective

    The concept of age-adjusted cancer rates enables a clearer comparison between regions by accounting for the variations in population age. As developed countries tend to have older populations, it’s crucial to adjust for age differences to ensure that the comparison of cancer burdens is fair and accurate.

    In 2022, data reflected that countries classified as having a high or very high Human Development Index (HDI) recorded alarming rates of cancer incidence. Specifically, age-adjusted rates were documented at 261.3 and 184.2 per 100,000 individuals, respectively. In contrast, countries with lower HDI showed significantly reduced rates, around 110 per 100,000. These disparities highlight a complex relationship between development and disease prevalence.

    Regional Variations: North America and Oceania in Focus

    Among wealthy nations, North America and Oceania displayed the highest overall cancer rates. Within this category, Australia and New Zealand were particularly noteworthy due to elevated cases of melanoma, a notably aggressive form of skin cancer. This trend raises questions about environmental and lifestyle factors that might be contributing to these numbers.

    Conversely, while North American countries struggle with significant rates of lung cancer, Scandinavian countries exhibit high colorectal cancer rates. Together, these patterns suggest that while developmental status plays a role in cancer incidence, specific lifestyle factors and environmental exposures also demand attention.

    Factors Influencing Cancer Incidence in Developed Countries

    Several factors contribute to the increased cancer rates in richer nations. Firstly, higher diagnosis rates play a crucial role. With advanced medical technology and screening programs, cancers that may have gone undetected in less developed regions are often caught early in wealthier populations.

    Additionally, genetic factors linked to survival play a complex role. Those who survive cancer may pass on susceptibilities to future generations, potentially influencing cancer trends over time.

    Lifestyle Choices: Smoking, Alcohol, and Their Effects

    In many developed nations, lifestyle choices such as smoking and excessive alcohol consumption remain significant contributors to cancer development. The correlation between these habits and various cancer types underscores the importance of public health initiatives aimed at reducing these risk factors as part of broader cancer prevention strategies.

    A Closer Look at Mortality Rates

    When examining mortality, North America, particularly the United States, exhibits superior outcomes compared to Europe and Oceania. The implementation of the Medicare system for those aged 65 and older ensures a higher standard of care for the elderly population, thus contributing to better survival rates among older patients.

    Moreover, the speed at which innovative treatments and drugs are made available to patients in the U.S. is remarkable, often outpacing other nations. This rapid translation of medical research into practice significantly influences cancer prognosis across the nation.

    The Paradox of Early Diagnosis and Treatment

    Despite higher diagnosis rates and advancements in treatment available in developed countries, mortality rates can still be concerning. In wealthier nations, cancer mortality rates range between 94-96 per 100,000, while in less developed countries, they hover around 73-76 per 100,000. This paradox suggests that even with early detection and better healthcare facilities, the battle against cancer remains complex, influenced by various medical, social, and economic factors.

    Insights from Lower HDI Countries

    In countries with low scores on the Human Development Index, the mortality rate from cancer surpasses that of medium scorers, even though incidences may be lower. This highlights the critical need for enhancing treatment access and healthcare infrastructure in poorer nations, where improvements could potentially save a substantial number of lives.

    The Broader Implications of Cancer Statistics

    The data regarding cancer incidence and mortality underscores the multifaceted nature of cancer care, encompassing diagnosis, treatment, and lifestyle choices. Developed nations face unique challenges that differ from those experienced by developing countries. Therefore, tailored approaches that consider both local realities and global health trends are essential for effectively combating cancer worldwide.

  • Lung Cancer: 1.8M Deaths in 2022, 20% of Cancer Mortality

    Lung Cancer: 1.8M Deaths in 2022, 20% of Cancer Mortality

    Understanding the Impact of Lung Cancer Worldwide

    Lung cancer remains a pressing global health concern, representing a significant portion of cancer-related mortality. According to the International Agency for Research on Cancer (IARC), lung cancer accounted for more than 1.8 million deaths in 2022, making it the most lethal form of cancer worldwide.

    The Statistics Behind Lung Cancer Mortality

    Lung cancer’s grim statistics highlight its dominance as the leading cause of cancer death. In comparison, colorectal cancer, which ranks second in mortality, resulted in only half as many deaths as lung cancer. This stark contrast underscores the severe impact lung cancer has on global health.

    Global Rankings of Cancer Types

    The stark figures illustrate that lung cancer is not merely a health issue but a major global crisis. The three most lethal cancer types—lung, colorectal, and liver cancer—tend to affect predominantly male populations. In stark contrast, breast cancer is the leading cause of cancer death among women, resulting in approximately 666,000 fatalities in 2022.

    Incidence of Lung Cancer Cases

    With about 2.5 million new diagnoses in 2022, lung cancer remains the most commonly diagnosed cancer type globally. The data reveals a gender disparity in diagnosis rates:

    • Men: Approximately 1.6 million new cases
    • Women: Approximately 900,000 new cases

    These statistics position lung cancer not only as a significant health risk but also as a gendered issue that calls for targeted healthcare strategies.

    Comparison with Other Common Cancers

    The prevalence of other cancers, such as prostate and breast cancer, further emphasizes the unique position lung cancer occupies. For men, prostate cancer was the second most commonly diagnosed cancer in 2022, with nearly 1.5 million new cases. Among women, breast cancer led the statistics with around 2.3 million new cases.

    Evolving Trends: Lung Cancer in Never-Smokers

    While lung cancer has traditionally been associated with tobacco use, emerging research suggests a troubling trend. Rates of lung cancer among never-smokers are on the rise. This phenomenon has become a point of concern, particularly in East Asia and China, where environmental factors appear to play a critical role.

    Air Pollution as a Driving Factor

    The increase in lung cancer cases among non-smokers is attributed primarily to air pollution, especially particulate matter (PM) pollution. Recent studies indicate that around 200,000 lung cancer cases in 2022 were linked to ambient PM pollution. This connection between environmental health and cancer incidence emphasizes the necessity of addressing pollution levels to mitigate lung cancer risks.

    The Regional Focus: East Asia and China

    In regions such as East Asia, where industrialization and urbanization are prevalent, the correlation between air quality and lung cancer rates is particularly evident. This acute incidence compels health officials and policymakers to scrutinize urban planning, industrial regulations, and public health initiatives aimed at reducing pollution.

    Case Studies and Public Health Strategies

    Urban areas in China, known for their severe air quality issues, exemplify the urgent need for public health interventions. As lung cancer cases continue to rise in these regions, comprehensive strategies encompassing both prevention and early detection will be crucial in combating this growing health crisis.

    The Importance of Awareness and Education

    Campaigns aimed at increasing public awareness regarding lung cancer, its risk factors, and preventive measures are vital. Educational programs can help inform both smokers and non-smokers on the dangers posed by air pollution and the importance of seeking medical attention for suspicious symptoms.

    Final Thoughts

    As lung cancer continues to dominate global cancer statistics, understanding its complexities—from incidence rates and demographic trends to the changing landscape of risk factors—is essential for driving forward effective health policies and strategies aimed at reduction and prevention. By fostering a greater understanding of lung cancer’s global impact, we can work collectively to improve health outcomes across diverse populations.

  • Best Beat ‘Em Up From 2022 Is Free Today On Epic Games Store

    Best Beat ‘Em Up From 2022 Is Free Today On Epic Games Store

    As Epic Games wraps up its holiday giveaway, the penultimate free title has been revealed. Sifu, the acclaimed beat ’em up from 2022, is available for download at no cost until 11 a.m. tomorrow, January 1. This game marries sleek, cinematic martial arts action with the relentless retry spirit typical of roguelikes, but each defeat comes with the inescapable toll of time.

    That might sound a little heavy-handed. Every time your character perishes, a magical amulet resurrects you, but you age slightly in the process. With each demise, you’ll notice your character grows visibly older and becomes more vulnerable to damage, although your attacks gain increased power. As you age, some abilities may become inaccessible, essentially transforming you into a delicate weapon. While you might be able to deliver devastating strikes, it only takes one blow to end your journey.

    If you let yourself get too old, dying will send you back to square one for the level. Fortunately, it seems that the key to maintaining youth lies in taking down bosses; defeating mini-bosses or finishing specific areas can shave off a year from your death count. Just try to steer clear of taking damage—after all, a few hits can really affect your character’s appearance.

    The giveaway features both Sifu and its Arenas Expansion. If you’re interested, you can also grab the Art of Sifu artbook for just an extra $5.

    Make no mistake: Sifu is a challenging experience, yet it balances that difficulty with an engaging combat system that keeps you coming back for more. You can download Sifu for free from the Epic Games Store until tomorrow.

  • U.S. Imports: 25% Tariff Impact on Trade with Mexico, Canada, China

    U.S. Imports: 25% Tariff Impact on Trade with Mexico, Canada, China

    Understanding U.S. Import Dynamics: A Focus on Mexico, Canada, and China

    As the global economy continues to evolve, the relationship between nations is increasingly defined by trade. In this context, the United States maintains significant import ties with its closest neighbors, Mexico and Canada, as well as the economic giant, China. Understanding what the U.S. imports from these countries provides valuable insight into both the economic influence of these nations and the complexities of trade agreements.

    Imports from Mexico

    Key Categories

    The U.S. imports a diverse range of products from Mexico, with notable categories including:

    • Automobiles and Auto Parts: Vehicles are the largest import by value, reflecting the deep integration of the auto industry across North American borders. Major manufacturers like General Motors and Ford source many components and assembly processes from Mexico.
    • Machinery: Mexico is also a significant supplier of machinery and computer equipment, contributing to various industries in the U.S.
    • Agricultural Products: The agriculture sector sees considerable imports, particularly fruits and vegetables, with Mexico being one of the largest suppliers.

    Impact of Increased Tariffs

    Recent discussions about potential increases in tariffs have raised concerns among businesses relying on these imports. A proposed 25% duty on goods from Mexico could lead to higher consumer prices and disrupt established supply chains. This threat is particularly pressing for companies that rely on just-in-time manufacturing practices.

    Imports from Canada

    Major Import Segments

    Canada is not only a top trade partner but also a vital source of several key imports:

    • Mineral Fuels: Canada is the largest supplier of crude oil to the U.S., highlighting the importance of this relationship to energy security.
    • Automotive Products: Like Mexico, Canada is intertwined in the automotive supply chain, providing parts and raw materials for vehicle assembly.
    • Wood Products: The lumber trade plays a crucial role, especially in the construction and housing industries.

    Tariff Implications

    The consideration of imposing tariffs on Canadian goods raises questions about the future of the United States-Mexico-Canada Agreement (USMCA). Any significant changes could unsettle commerce and lead to retaliatory measures from Canada, impacting businesses on both sides of the border.

    Imports from China

    Dominant Product Categories

    China stands as one of the largest exporters to the U.S., with imports heavily concentrated in specific sectors:

    • Electronics and Machinery: Products such as computers, telecommunication equipment, and household appliances represent a significant portion of imports.
    • Plastic Goods: China also exports a variety of plastic products, which are critical for numerous industries, from manufacturing to retail.
    • Miscellaneous Items: This category includes an array of consumer products, indicating China’s vast production capabilities.

    Trade War Consequences

    The history of tariffs imposed during previous trade disputes has shown a pattern of escalation. If new tariffs were enacted, it could instigate another round of retaliatory tariffs from China, resulting in a direct impact on U.S. exporters. The agricultural sector, in particular, could face severe consequences, as it did during the last trade conflict, where farmers suffered substantial losses.

    The Interconnected Nature of Trade

    The relationships between the U.S., Mexico, Canada, and China are emblematic of a broader theme in global trade: interconnectedness. The import patterns reflect not just the economic needs of the U.S. but also the geopolitical realities that shape these transactions.

    Fentanyl and Immigration Concerns

    In addition to economic discussions, political factors also play a crucial role. Issues surrounding the production and trafficking of fentanyl, alongside concerns about illegal immigration, have framed trade negotiations in recent years. The articulation of these concerns highlights that trade policies extend beyond mere economics—they are entwined with national security and social issues.

    The Future of U.S. Trade Policy

    As the landscape continues to shift with changing administrations and policies, the future of U.S. trade relations with Mexico, Canada, and China remains uncertain. The positions taken by leaders and the subsequent implications for tariffs will significantly influence these countries’ roles in U.S. imports.

    This analysis of U.S. imports illustrates the delicate balance of trade relationships, the potential consequences of policy changes, and the intricate ties that bind these nations in the fabric of global commerce.

  • Taylor Swift: 2024’s Most Streamed Artist with 1 Billion+ Plays

    Taylor Swift: 2024’s Most Streamed Artist with 1 Billion+ Plays

    Spotify Wrapped 2024: Taylor Swift Reigns Supreme Again

    Introduction to Spotify Wrapped

    Spotify Wrapped is more than just an annual highlight for music enthusiasts; it has become a cultural phenomenon in itself. Each year, Spotify presents its subscribers with a personalized recap of their listening habits, showcasing the songs, artists, and genres that captivated them throughout the year. This 2024 edition has unveiled some fascinating insights about the most popular artists, with Taylor Swift firmly in the spotlight once more.

    Taylor Swift: The Reigning Queen of Spotify

    A Consistent Chart-Topper

    In 2024, Taylor Swift has once again proven her dominance in the streaming world by being crowned the most streamed artist globally. This marks her consecutive year at the top of the charts, following her achievement in 2023, where she was also the leading artist, and a strong second in 2022. Swift’s music spans multiple genres, mainly pop and country, making her appeal broad and her fan base passionate.

    The Power of Pop

    Swift’s success is a testament to the enduring popularity of the pop genre. With her strategic album releases and ability to connect with her audience, she has maintained a solid foothold in the music industry. Her ability to adapt her sound while staying true to her roots contributes to her ongoing success on platforms like Spotify.

    The Competition: Artists on the Rise

    The Weeknd: A Dominant Male Presence

    Following Swift, The Weeknd claims the second position as the most streamed artist in 2024. As the number one male artist globally, he showcases the massive appeal of rap and R&B genres. His unique sound, characterized by blending pop, hip-hop, and soulful elements, has garnered him a dedicated fan base, solidifying his status as a global music icon.

    Bad Bunny: The Reggaeton Sensation

    Bad Bunny continues to shine in the music industry, securing a spot within the top three most streamed artists for three years running. His innovative reggaeton tracks and collaborations with various artists have significantly contributed to his widespread popularity.

    The Rising Artists of 2024

    New Faces in the Top Ten

    The landscape of music is ever-evolving, with new talents emerging each year. In 2024, Peso Pluma, Kanye West, Ariana Grande, and Feid have made their mark by rounding off the top ten. The eclectic mix of these artists reflects the diverse musical tastes of Spotify listeners globally.

    Dominant Tracks of the Year

    Top Five Most Streamed Songs

    Spotify Wrapped 2024 has revealed the songs that resonated most with listeners, placing Sabrina Carpenter’s “Espresso” at the top spot. Following closely are:

    1. Sabrina Carpenter – Espresso
    2. Benson Boone – Beautiful Things
    3. Billie Eilish – Birds of a Feather
    4. Floyy Menor & Cris Mj – Gata Only
    5. Teddy Swims – Lose Control

    These tracks showcase the versatility of popular music this year, with artists from different genres capturing the hearts of listeners worldwide.

    The Evolution of Spotify Wrapped

    A Brief History

    Launched in 2016 as a rebranding of Spotify’s “Year In Music” feature, Spotify Wrapped has continually evolved over the years. The introduction of the “Your Top Songs” playlist and the subsequent additions of interactive videos and features like “Audio Aura” indicate Spotify’s commitment to enhancing user experience.

    2024 Theme: Music Evolution

    The 2024 Spotify Wrapped embraces the theme of “Music Evolution,” celebrating artist collaborations that challenge traditional genre boundaries. With notable partnerships, such as Billie Eilish with Charlie xcx and Lady Gaga with Bruno Mars, Spotify emphasizes the fluidity of contemporary music and how it shapes pop culture. This year’s theme reflects the listeners’ journey and highlights the unexpected emergence of new genres and styles.

    Celebrating Global Music Trends

    Genres that Resonate

    As portrayed in the Spotify Wrapped data, pop and rap/R&B genres have a significant hold on global listeners. This underscores a broader trend of these genres transcending cultural boundaries, resonating across various demographics and regions.

    The Impact of Collaborations

    Highlighting collaborations between artists demonstrates how the music landscape is increasingly becoming a melting pot of styles. Such partnerships not only enhance creativity but also bring different fan bases together, enriching the listening experience.

    The Future of Spotify Wrapped

    As Spotify continues to innovate and adapt to the fast-paced world of music consumption, the future of Spotify Wrapped is bound to be exciting. With each passing year, the platform seeks to deepen its connection with listeners, allowing them to celebrate their musical journeys in new and meaningful ways.

  • Freelancers Face Pension Cuts: 17% in Mexico to 115% in US

    Freelancers Face Pension Cuts: 17% in Mexico to 115% in US

    Understanding the Pension Prospects for Freelancers: A Global Overview

    The world of freelancing offers flexibility and independence, but it comes with certain risks, especially when it comes to pension prospects. As self-employed individuals navigate their careers, understanding their retirement benefits is crucial. This blog delves into the key findings from the OECD Pensions at a Glance 2023 report, highlighting the stark differences in pension outcomes for self-employed versus employed workers across various countries.

    The Pension Landscape for Self-Employed Workers

    Freelancers across OECD countries face significant challenges compared to their employed counterparts regarding old-age pensions. The average pension for self-employed individuals stands at only 79% of what employed people earn in the OECD. However, this figure masks substantial variations across different nations, with some countries demonstrating particularly alarming statistics.

    Extreme Variations Among Countries

    • Mexico: Self-employed workers are at a severe disadvantage, receiving merely 17% of the pension that employed individuals earn.
    • Germany: The situation is slightly better but still concerning, with self-employed individuals earning only 44% of their employed peers’ pensions.
    • United Kingdom: The self-employed can expect to receive 52% of the pension of those in traditional employment.

    Such wide disparities underscore the complex relationship between self-employment and pension contributions in varying countries.

    Factors Influencing Pension Contributions

    The difference in pension outcomes can be largely attributed to the policies of individual countries regarding pension contributions for self-employed workers. Some nations have made it mandatory for self-employed individuals to contribute to earnings-related pension schemes, while others have not.

    Categories of Pension Contribution Systems

    The OECD categorizes countries based on how they require contributions from self-employed individuals:

    1. Mandatory Employee-like Schemes: In 13 countries, including Canada, the United States, and Luxembourg, self-employed workers are required to contribute the same combined amount as employees. This provides a more equitable path to retirement benefits.

    2. Limited Coverage with Reduced Contributions: In 12 countries, such as France and Italy, self-employed workers can choose to make reduced contributions, impacting their overall pension prospects.

    3. Flat-Rate Lower Contributions: Nations like Colombia and Spain fall into this category, where self-employed individuals pay a flat-rate, which is generally lower than what employed individuals contribute.

    4. Mandatory Basic Pension Contributions Only: Some countries, including Ireland and the Netherlands, require contributions to basic pensions only, leaving gaps in earnings-related pensions for the self-employed.

    5. No Mandatory Contributions: Countries like Australia and Mexico do not have mandatory contributions for self-employed individuals, further exacerbating the pension predicament for freelancers.

    Suggested Strategies for Enhanced Pension Security

    For self-employed individuals, understanding one’s pension rights and obligations is vital. Here are a few strategies that freelancers can consider to improve their pension prospects:

    Voluntary Contributions

    Freelancers should consider making voluntary contributions to their pension schemes, particularly if their country allows it. This can compensate for lower mandatory contributions and secure a better retirement income.

    Consultation with Financial Advisors

    Seeking guidance from financial advisors who understand the nuances of pension schemes in different countries can provide personalized strategies for maximizing retirement savings.

    Exploring Alternate Pension Schemes

    In some countries, freelancers may have access to alternative pension schemes or retirement savings accounts designed for self-employed individuals. Understanding these options can lead to better financial health in retirement.

    The Role of Policy in Shaping Pension Outcomes

    The findings from the OECD report highlight an urgent need for reevaluation of policies impacting self-employed pension contributions. Countries that currently offer less favorable conditions for freelancers may need to consider reforms to ensure more equitable treatment in retirement benefits.

    By addressing the disparities and creating frameworks that encourage adequate pension contributions, nations can significantly improve the financial security of their self-employed workforce.

  • Healthy Retirement: Average 12 Years for Europeans Post-63

    Healthy Retirement: Average 12 Years for Europeans Post-63

    Understanding Healthy Life Expectancy After Retirement in Europe

    As discussions around retirement age and policies continue to evolve, understanding healthy life expectancy is increasingly vital. A critical aspect of retirement planning is not just how long individuals can expect to live but how many of those years will be spent in good health. This blog delves into the recent findings regarding healthy life expectancy after retirement across various European countries, revealing stark contrasts and implications for retirees.

    The Definition of Healthy Life Expectancy

    Healthy life expectancy (HALE) refers to the number of years individuals can expect to live without severe health issues or disabilities. This metric provides valuable insight into the quality of life during retirement rather than merely the quantity of years. As people age, maintaining a high quality of life becomes a paramount concern.

    Insights from European Countries

    In 2022, an analysis covering 29 European countries highlighted that the average life expectancy in good health after retirement was approximately 12 years, with the EU-27 averaging around 11.7 years. These figures underscore the importance of looking beyond lifespan to the quality of those years in retirement.

    Countries with the Highest Healthy Life Expectancy

    • Norway: Norwegian retirees can expect to enjoy around 15 to 16 healthy years post-retirement. This is indicative of the country’s overall health standards, social security systems, and proactive health measures.

    • Slovenia and Luxembourg: Both nations follow closely behind, with their retirees also anticipating significant healthy years in retirement. An effective average exit age from the labor market of about 60 years contributes positively to their health metrics.

    • Maltese, Belgians, French, and Swedes: These countries also report healthy life expectancies exceeding the European average, ranging from 14 to 15 years. The combination of lower retirement ages and healthier living conditions plays a critical role here.

    Countries with the Lowest Healthy Life Expectancy

    Conversely, several nations exhibit significantly lower years of healthy life expectancy after retirement:

    • Baltic States, Portugal, and Romania: These countries show a considerably reduced expectancy, with some regions having averages below 10 years.

    • Estonia and Romania: The situation is particularly alarming in these nations, where healthy life expectancy plummets to under 7 years and even as low as 5 years in Romania. This scenario arises from late retirement ages (often 65 or older) and poorer overall health indicators within the population.

    The Role of Retirement Age in Healthy Life Expectancy

    The effective average age of exit from the labor market plays a fundamental role in determining the number of healthy years lived post-retirement. For example, the trend in Luxembourg and Slovenia, where individuals retire around the age of 60, correlates with a higher number of healthy life years. In contrast, countries with later retirement ages often struggle with a more significant drop-off in health quality as seniors age.

    Variability Among Occupational Categories

    It’s crucial to remember that healthy life expectancy can vary significantly not only across countries but also across different occupational categories. Factors such as socioeconomic status, job-related stress, and healthcare access markedly influence health outcomes and overall well-being in later years.

    Implications for Policy and Personal Planning

    Given the disparities in healthy life expectancy after retirement, there are critical implications for both policymakers and individuals planning their retirement. For governments, there is a pressing need to consider health outcomes in their retirement policies. For individuals, understanding these factors can influence personal savings strategies and health maintenance efforts leading up to retirement.

    The findings emphasize the importance of not only planning for financial stability in retirement but also focusing on activities, health care, and community engagement that can enhance quality of life in the years after leaving the workforce.

  • China Claims 31% of Global Manufacturing Output in 2022

    China Claims 31% of Global Manufacturing Output in 2022

    China’s Manufacturing Dominance: A Global Powerhouse

    Overview of China’s Manufacturing Contribution

    According to data from the United Nations Statistics Division, China has solidified its position as the world’s largest manufacturing powerhouse, contributing a staggering 31 percent of global manufacturing output in 2022. This remarkable figure is nearly 15 percentage points ahead of the second-place United States, which, prior to being overtaken by China in 2010, held the title of the world’s largest manufacturing sector. The trajectory of China’s rise in the global manufacturing landscape is a testament to its strategic economic policies and robust industrial capabilities.

    Economic Impact of Manufacturing in China

    Contribution to National GDP

    In 2022, the value added by China’s manufacturing sector reached over $5 trillion, accounting for nearly 30 percent of the country’s total economic output. This substantial figure underscores the critical role manufacturing plays in China’s economy. Unlike the United States, where the manufacturing sector represented just over 10 percent of the gross domestic product (GDP) in the same year, China’s economy remains heavily reliant on manufacturing to drive growth and innovation.

    Comparison with Other Manufacturing Nations

    China’s manufacturing industry is not only significant on its own but also dwarfs the output of other nations. The value added in China’s manufacturing sector is roughly equivalent to the combined output of the next seven largest manufacturing countries globally. This striking statistic highlights the scale and efficiency of China’s industrial operations, reinforcing its status as a manufacturing titan.

    Historical Context: The Rise of China

    Overtaking the United States

    The transition of the manufacturing crown from the United States to China represents a pivotal shift in the global economy. China’s ascendancy in manufacturing began in earnest in the late 20th century, propelled by reforms that opened up the economy, attracted foreign investment, and fostered technological advancements. By 2010, these efforts culminated in China’s overtaking of the United States as the world’s primary manufacturing leader.

    Strategic Initiatives

    China’s government has long pursued policies aimed at enhancing its manufacturing capabilities. Initiatives such as "Made in China 2025" aim to upgrade the country’s manufacturing base, focusing on high-tech and strategically essential industries. These efforts not only enhance efficiency but also position China at the forefront of innovation in sectors such as robotics, aerospace, and renewable energy technologies.

    Global Manufacturing Landscape

    Comparison with Other Leading Nations

    As China continues to dominate, the manufacturing sectors of other nations are also worth examining. Countries like the United States, Japan, Germany, and South Korea each have significant manufacturing output, but none approach the scale of China’s industrial landscape. The strategic focus for many of these nations has increasingly shifted towards advanced manufacturing techniques and automation, attempting to recapture market share and improve productivity.

    The Role of Global Supply Chains

    China’s manufacturing capability has significant implications for global supply chains. Many international companies rely on China’s abilities to produce goods at scale, leading to interdependence between nations. This has been particularly evident during global events, such as the COVID-19 pandemic, when disruptions to Chinese manufacturing had ripple effects across the globe, demonstrating just how integral the nation is to global commerce.

    Future Outlook

    Innovations in Manufacturing

    As the manufacturing landscape evolves, China is poised to embrace cutting-edge technologies such as artificial intelligence, big data, and the Internet of Things (IoT) to further enhance production efficiencies. These innovations are expected to shape the future of manufacturing, making processes faster, more efficient, and capable of meeting the demands of a changing global market.

    Challenges Ahead

    Despite its strong position, China faces various challenges, including rising labor costs, environmental regulations, and geopolitical tensions that could affect its manufacturing sector. How China navigates these challenges will be crucial in maintaining its status as a manufacturing superpower in the years to come.

    The dynamic nature of the global economy and ongoing technological advancements will continue to redefine China’s role in global manufacturing, making it an intriguing subject for analysis and discussion moving forward.

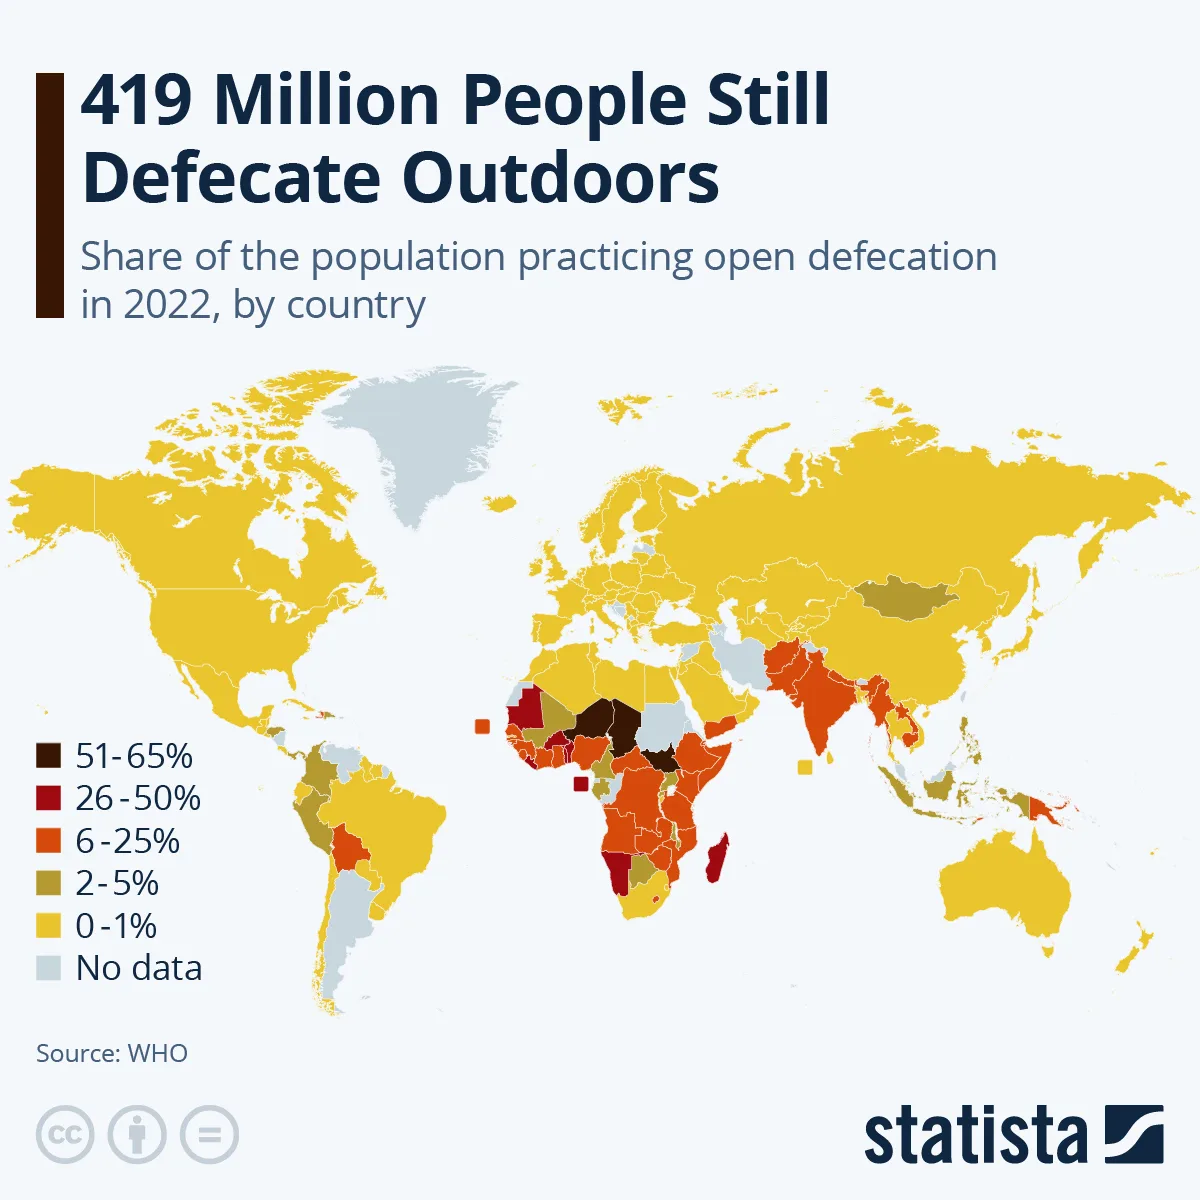
  • 491 Million Still Defecate Outdoors: Global Sanitation Crisis

    491 Million Still Defecate Outdoors: Global Sanitation Crisis

    The Global Sanitation Crisis: Understanding Open Defecation

    The issue of open defecation remains one of the most pressing sanitation challenges facing the world today. Despite global efforts to improve access to sanitation facilities, millions of people continue to lack even the most basic toilet services, leading to significant health and environmental consequences.

    Current Statistics on Sanitation Access

    As of 2022, an alarming 491 million people were still practicing open defecation. This statistic highlights that, despite improvements over the years, there remains a significant global health crisis related to inadequate sanitation access. The United Nations has recognized this issue, with November 19 designated as World Toilet Day, focused on promoting the importance of sanitation for health and dignity.

    Global Distribution of Those Affected

    In the context of global sanitation, it is sobering to note that approximately 3.5 billion individuals do not have access to safe and adequate toilets. This means that about 19% of the world’s population lacks at least basic sanitation services, which include private toilets connected to sewage systems or alternatives such as septic tanks or pit latrines.

    Impact of Conflict and Climate Change

    The theme for World Toilet Day 2022, "Toilets: A Place for Peace," underscores how sanitation access is often compromised in situations of conflict and climate-related disasters. Data from UNICEF reveals that children living in extremely fragile contexts are disproportionately affected, being three times more likely to engage in open defecation and face a severe lack of basic sanitation and drinking water services.

    Progress and Continued Challenges

    Over the last two decades, the global situation regarding open defecation has improved; in the year 2000, about 1.3 billion people were reported to be defecating outdoors. By 2017, this figure had decreased to 673 million, revealing the ongoing commitment by various governments and organizations to tackle this issue. The reduction to 491 million in 2022 is a significant step forward, yet it still highlights the critical need for continued efforts.

    Regional Disparities

    Progress has not been uniform across the globe. Sub-Saharan Africa continues to experience challenges due to rapid population growth, which places increased pressure on sanitation services. On the other hand, countries like Cambodia, Ethiopia, Nepal, and India have seen substantial decreases in outdoor defecation rates.

    In India, for instance, the movement toward improved sanitation has been marked by the Swachh Bharat Abhiyan initiative, launched in 2014. Prior to this campaign, more than 60% of the population lacked access to a household toilet. The initiative has reportedly reduced the rate of open defecation to 11% by 2022, showcasing a significant improvement.

    Health Risks Associated with Poor Sanitation

    The absence of proper sanitation facilities is not just an inconvenience; it poses severe health risks. Open defecation often leads to the contamination of water supplies, facilitating the spread of diseases and pathogens. Without safe sanitation, communities are vulnerable to a myriad of health issues, exacerbating existing burdens on healthcare systems.

    The Role of Government and NGOs

    Efforts to eradicate open defecation require a multifaceted approach, involving not only government initiatives but also the active participation of non-governmental organizations (NGOs) and local communities. Sustainable changes can be achieved through infrastructure development, education on hygiene practices, and the establishment of community-led initiatives that encourage ownership and maintenance of sanitation facilities.

    The Importance of Sustainable Solutions

    Access to safe and adequate toilets is a basic human right and is essential for health, dignity, and well-being. The ongoing efforts to improve sanitation must adapt to changing social and environmental conditions, ensuring that solutions are sustainable and equitable. The concerted actions taken today will pave the way for a future where sanitation is a given rather than a privilege.

  • U.S. Childcare Costs: 37% for Singles, 20% for Couples

    U.S. Childcare Costs: 37% for Singles, 20% for Couples

    The Rising Costs of Childcare in the United States Compared to Other Developed Nations

    Childcare costs have become a pressing issue for many families, particularly in the United States, where prices consistently outstrip those in other developed countries. An analysis of childcare expenses reveals stark disparities, highlighting how American families, especially single parents, are disproportionately affected by these high costs.

    Understanding Childcare Costs in the U.S.

    In the United States, the financial burden of childcare is particularly heavy for families earning average incomes. According to data from the OECD in 2022, couples who both work full-time and earn average wages must allocate approximately 20% of their disposable household income to cover the costs of childcare for two young children. This percentage is significantly higher for single parents, who find themselves spending an alarming 37% of their disposable income.

    Comparative Costs Among OECD Countries

    When comparing childcare costs across OECD countries, the United States emerges as the most expensive option. Switzerland ranks as the second highest, where couples with two children spend about 32% of their disposable income on childcare, while single parents spend around 18%. This stark contrast underscores the challenges faced by American families compared to those in other developed nations.

    The Role of Private Sector Dominance

    A significant factor driving the high costs of childcare in the U.S. is the dominance of the private sector within this market. Unlike many other countries, where childcare services are provided as public services or heavily subsidized, the U.S. market remains largely unregulated. This lack of government intervention results in soaring market rates. Treasury Secretary Janet Yellen has referred to this situation as a "broken market," emphasizing the need for reform in the childcare sector.

    Challenges Faced by Anglophone Nations

    It’s not just the United States that faces challenges with childcare costs; several Anglophone nations share similar struggles. Countries like Ireland, New Zealand, and Australia experience high private market rates alongside low subsidies, further exacerbating the financial pressure on families. Though Canada has recently adjusted its policies to provide more relief, couples in Canada still pay about 19% of their disposable income on childcare as of 2022, suggesting that these issues are not limited to the U.S. alone.

    Comparative Analysis with Other National Models

    In contrast to the high expenses found in the U.S. and some Anglophone nations, European countries generally enjoy significantly lower childcare costs. In France, for example, full-time working parents typically spend only between 6% and 10% of their disposable income on childcare. Similar patterns emerge in other nations, such as South Korea and many Scandinavian countries, where government support and subsidies help mitigate the financial burden for families.

    Notable Exceptions in Europe

    Some European countries have made considerable strides in making childcare more affordable. Germany offers childcare vouchers based on work hours, resulting in rates as low as 1% of disposable income for working parents. In Italy and Latvia, free childcare is provided, alleviating the need for any financial outlay from parents. Additionally, single parents in Greece are exempt from childcare fees, while Canada, the U.K., and Japan offer various support systems that mitigate costs for low-income families.

    The Need for Reform in Childcare Policies

    The differences in childcare affordability highlight the urgency for reform, particularly in the United States. As demographic changes put additional pressure on families, the need for a more sustainable and supportive childcare framework becomes even clearer. Policymakers and stakeholders must consider the successful models implemented in other countries and address the high costs that American families currently face.

  • Top December 2022 Fitness Deals

    Top December 2022 Fitness Deals

    Maintaining a healthy lifestyle is crucial, whether through regular jogging or weight training. If outdoor workouts aren’t appealing, particularly due to weather conditions, fitness equipment allows you to exercise comfortably at home. Fortunately, there are plenty of fantastic offers on a variety of gear, meaning you can get started without breaking the bank. If you’re looking to elevate your home fitness environment, be sure to check out some home gym specials. Below are some of our top picks for fitness equipment deals, and you can also explore options from NordicTrack and Bowflex for even more choices.

    Bowflex SelectTech 552 Adjustable Dumbbells — $429 $549 22% off

    Bowflex

    If you’re interested in strength training but want to avoid the hassle of acquiring multiple weights, adjustable dumbbells are a perfect solution. The Bowflex SelectTech 552 offers a range of weights, going up to 52.5 pounds in 15 increments, allowing you to increase resistance gradually. Additionally, this purchase includes a two-month all-access subscription to JRNY, a valuable resource to kickstart your fitness journey.

    Echelon Stair Climber Sport — $500 $600 17% off

    Echelon Stair Climber Sport
    Echelon

    Ascending and descending stairs can be a challenging workout and an exceptional way to enhance your cardio fitness. The Echelon Stair Climber offers three incline levels and features wheels for easy mobility. Its ability to store flat is an added benefit, and it comes with a 30-day subscription to Echelon Choice, providing access to a wide range of on-demand classes. Keep in mind that you’ll need a My Best Buy Plus subscription to secure this deal.

    Echelon Stride 30 — $600 $700 14% off

    Echelon Stride
    Echelon

    Not every treadmill has to come with a hefty price tag, and the Echelon Stride proves to be a budget-friendly choice packed with features. Its long, narrow 16 x 47-inch running surface fits well in smaller spaces. With a maximum speed of ten miles per hour and 15 pre-programmed workout options, it provides plenty of variety for those just beginning their fitness journey.

    NordicTrack Commercial VU29 Exercise Bike — $899 $1,299 31% off

    NordicTrack Commercial VU29 Exercise Bike in use.
    NordicTrack

    The NordicTrack Commercial VU29 is ideal for low-impact cardio workouts. This bike is designed for quiet operation, making it perfect for users who need minimal noise pollution from their equipment. With a complimentary 30-day subscription to iFIT, the bike trainer can customize your 24 digital resistance levels, allowing for a realistic cycling experience using Google Maps for simulated locations. Suitable for users up to 325 pounds, it’s perfect for those looking to stay active while working from home or caring for a baby.

    Schwinn 430 Elliptical Machine — $900 $999 10% off

    A woman using the Schwinn 470 Compact Elliptical Machine.
    Schwinn

    The Schwinn 470 Elliptical provides an engaging workout experience with its 20-inch stride and foot motion technology designed to replicate a natural running motion. With 25 resistance levels and a maximum incline of 10 degrees, you can tailor your workout to meet your fitness goals. You also have access to over 200 virtual courses and 29 workout programs, giving you ample options for challenges and variety.

    Matrix ICR50 Indoor Cycle with IX Display — $999 $1,398 29% off

    Matrix ICR50 Indoor Cycle.
    Matrix

    If you prefer a classic cycling experience, the Matrix ICR50 features a magnetic resistance system that mimics riding a traditional bike. With 11 adjustable resistance levels, this machine is suitable for both beginners and those looking to intensify their workouts. However, keep in mind that it lacks a display screen or heart rate monitor. If those features are important to you, there is an additional fee of $50 with a My Best Buy Plus membership.

    Marcy Pro Smith Cage Workout Machine — $1,300 $1,500 13% off

    Marcy Pro Smith Cage Workout Machine.
    Marcy

    If you’re searching for a comprehensive workout equipment solution, the Marcy Pro Smith Cage may be your ideal choice. It offers multiple options for chest and arm strength training along with a leg press and sit-up station, complete with six weight plate holders for organization. Constructed with a reinforced design and a heavy-duty steel frame, this equipment is built to last while providing ergonomic seating for optimal comfort during your workouts.

    NordicTrack RW900 Smart Rower — $1,750 $1,999 12% off

    NordicTrack RW900 rowing machine.
    .

    The NordicTrack RW900 Smart Rower offers a realistic rowing experience, allowing you to reap the benefits of this low-impact exercise regardless of weather conditions. Featuring 26 resistance levels, this rower is perfect for honing basic form or adding intensity to your workout. It also includes a 22-inch HD screen with access to guided iFIT training sessions. You’ll receive 30 days of iFIT complimentary, during which trainers will automatically adjust your resistance and lead you through workouts.

    Explore More Great Deals on Gym Equipment, Apparel, and Fitness Technology

    Fitness trackers are an excellent tool for anyone looking to improve their health journey. These devices typically sync with your smartphone’s health app, allowing you to monitor your steps, distance covered while running or cycling, calories burned, and more. They are often waterproof, dustproof, and built to withstand daily wear, making them suitable for any activity.

    Resistance bands are versatile fitness tools that can enhance your workouts anywhere. They are lightweight and usually come with a carrying pouch for portability. Alternatively, consider total home gyms, which consolidate your favorite machines into one convenient unit. While these can be a bit pricey, they ultimately save on monthly gym fees and can offer great alternative fitness equipment options like ellipticals and treadmills at discounted rates.

    If you prefer minimal equipment, yoga is an excellent way to connect with your body and spirit. It requires very few supplies, mainly a good yoga mat, and there are numerous options available in various colors and sizes. A deal on a yoga mat can also be found if you’re looking to start your practice.

    Dumbbells are a time-honored choice in fitness equipment, but equipping your home gym with various weights can be expensive and take up significant space. Thankfully, adjustable dumbbells provide a space-saving and cost-effective solution. These sets allow for quick adjustments to weight, enabling you to tailor your workouts for different muscle groups while managing your reps and sets effectively.

    Exercise and diet go hand in hand. Your body needs the right fuel to function optimally. Meal kit deals can streamline meal prep and ensure you have a healthy structure to follow.

    For even more fantastic finds, be sure to explore our curated deals page.