Category: Infotainment

  • Horror Movie Viewing Trends: 49% in Mexico, 40% in US

    Horror Movie Viewing Trends: 49% in Mexico, 40% in US

    The Global Appeal of Horror: Where Viewers Are Engaging with the Genre

    As Halloween approaches, the spotlight on horror content increases dramatically, making it the perfect time to explore the international landscape of horror movie viewership. A recent survey conducted by Statista Consumer Insights between October 2023 and September 2024 shed light on the popularity of horror movies across various countries, revealing fascinating insights into cultural preferences and viewing habits.

    The Horror Genre: A Universal Fascination

    Horror in Mexico: The Cultural Connection

    In Mexico, a staggering 49% of respondents have expressed their fondness for watching horror movies and shows, whether online or through traditional television. Edwin Pagan, founder of LatinHorror.com, provides compelling reasoning behind this strong interest. He notes that the nation’s rich tapestry of stories, steeped in the supernatural, plays a significant role in shaping the cultural affinity for horror.

    Pagan explains that ghost stories and macabre tales have been part of the cultural fabric for generations, suggesting that horror is not only entertainment but a tradition ingrained in the societal psyche. This cultural backdrop helps explain why horror resonates deeply with audiences in Mexico, making it a favorite genre during Halloween and beyond.

    The United States: A Hub for Horror

    The United States, renowned as the land of Hollywood, also holds a significant place in the horror genre landscape. Among American respondents, 40% reported that they watch horror content occasionally. This statistic underscores the widespread appeal of horror films in a country known for producing some of the most iconic titles in the genre.

    While horror ranks fifth among film genres in the U.S., it still boasts a substantial following. According to the Statista survey, the genre trails behind comedies, dramas, thrillers/mysteries/crimes, and documentaries, with each of these genres garnering a higher percentage of viewers. Despite its fifth-place ranking, the enduring popularity of horror films signifies a robust interest that cuts across various demographics.

    Exploring Global Viewing Habits

    The Rise of Streaming Platforms

    As streaming platforms continue to expand their libraries, the accessibility of horror content has skyrocketed. This shift in viewing habits offers audiences the ability to engage with a diverse array of horror films from different cultures, expanding their appreciation and understanding of the genre. From classic horror to indie films and international narratives, viewers can now explore horror beyond their geographic boundaries.

    Horror and Cultural Representation

    The representation of horror in different cultures speaks to a larger narrative within filmmaking. Stories that tap into local folklore or societal fears often resonate more profoundly with audiences. For instance, Mexican horror films frequently incorporate elements of superstition and ghostly folklore, while American horror might explore themes of isolation or societal collapse. This intersection of culture and horror creates a unique viewing experience that can evoke strong emotional responses.

    Seasonal Impact on Horror Consumption

    Halloween: The Horror Viewing Peak

    The Halloween season serves as a catalyst for horror consumption worldwide. As households prepare for trick-or-treaters and decorate with spooky themes, the demand for horror movies surges. Streaming platforms and television networks capitalize on this trend by promoting themed content, classic horror films, and new releases that cater to the seasonal appetite for scares.

    Community Viewing Events

    In many communities, Halloween is celebrated with more than just individual viewing; it often includes community events such as horror movie nights, haunted houses, and ghost story readings. These activities foster a sense of camaraderie among fans of the genre and highlight the communal aspect of horror viewing. The thrill of sharing the experience of a scary movie enhances the enjoyment and reinforces the social ties among horror enthusiasts.

    The Evolution of Horror Genres

    Expanding Subgenres

    Horror is not a monolithic genre; it encompasses numerous subgenres that cater to varying tastes. From psychological thrillers to supernatural horrors and slasher films, there is something for everyone. This diversification in horror allows for more extensive audience engagement and the possibility of attracting viewers who might not initially consider themselves fans of horror.

    The Role of Technological Advances

    Advancements in technology have also reshaped the horror landscape, particularly regarding production quality and special effects. Modern filmmakers leverage technology to create immersive experiences that heighten suspense and terror, drawing in a new generation of horror fans eager for innovative storytelling and breathtaking visuals.

  • Global Skepticism: 80% Doubt Influence of Russia and Iran

    Global Skepticism: 80% Doubt Influence of Russia and Iran

    The Growing Influence of BRICS on the Global Stage

    The BRICS summit, convening in Kazan, Russia, marks a significant moment in the evolution of international relations. With the recent inclusion of countries like Iran, Ethiopia, Egypt, and the United Arab Emirates, the bloc—consisting of Brazil, Russia, India, China, and South Africa—has expanded its ranks to form a more formidable coalition. This development reflects the increasing significance of BRICS as a counterbalance to Western-centric groups like the G7.

    BRICS: A New Global Power Structure

    The enlargement of the BRICS group provides a fresh dynamic in global politics and economics. By incorporating diverse nations, the bloc aims to enhance its bargaining power, diversify its perspectives, and foster greater economic cooperation among emerging markets. The anticipated inclusion of Saudi Arabia adds another layer of significance, potentially reshaping energy politics and global economic interactions.

    Public Perceptions of Global Influence

    A recent Ipsos survey comprising insights from approximately 23,800 adults across 31 nations reveals a prevailing skepticism regarding the intentions behind nations’ foreign influences. The data suggests a growing disillusionment with powers like Russia and Iran, with many respondents associating their international actions primarily with negative outcomes.

    Russia and Iran: A Lamentable Reputation

    The survey indicates a stark decline in perceptions of Russia and Iran, with only one in ten respondents believing that these nations use their influence for positive purposes. This growing skepticism has become increasingly pronounced since 2019, highlighting a significant trend in public opinion—a movement away from viewing these countries as constructive players on the global stage.

    China: A Mixed Bag of Opinions

    China’s global outreach also encounters scrutiny, but opinions are more divided. Approximately 30% of survey participants characterize China’s influence abroad as primarily negative, while another segment believes that its foreign policies are a blend of both beneficial and detrimental effects. Notably, perceptions of China have diminished, showing a decline of 10 percentage points since the last survey iteration.

    India: A Bright Spot Among BRICS

    In contrast to its BRICS counterparts, India fares relatively better in global perception. The survey reports that only 12% of respondents view India’s influence as mostly harmful. Interestingly, a considerable number of people—about 30%—believe India does not exert significant influence at all, suggesting a more neutral stance towards the nation.

    The United States: A Polarizing Presence

    The findings also shed light on the views of the United States, a pivotal player within the G7. The U.S. holds the dubious honor of having the highest percentage of respondents categorize its influence as both beneficial and harmful, standing at 36%. In South Korea, this figure escalates to 50%, indicating a notable divide in perceptions among various demographics.

    Comparative Views: U.S. and Israel

    While skepticism abounds, there is also a considerable proportion of individuals who perceive the U.S. and Israel positively. Approximately 34% of participants associate the U.S. with positive influence, while 31% extend similar views towards Israel. This duality reflects the complexities of global attitudes towards these influential nations.

    Underrepresentation in Global Surveys

    Although the Ipsos survey provides a comprehensive look into global perceptions, it is crucial to note that certain regions remain underrepresented. For instance, South Africa is the sole African nation included in the survey, which risks skewing the overall understanding of global sentiment and may overlook vital perspectives from other emerging economies across the continent.

    The BRICS Summit: Opportunities Ahead

    Gatherings like the BRICS summit enable dialogue on pressing global issues, fostering cooperation that transcends traditional geopolitical boundaries. The bloc’s growing influence signals a shift in power dynamics, highlighting the need for collaborative approaches as nations navigate complex challenges in an increasingly interconnected world.

    The evolving narrative of global leadership, as illustrated by the expansive influence of BRICS, serves as a reminder of the changing tides in international relations and the diverse perspectives that shape our collective future.

  • U.S. Dollar Accounts for 49.1% of SWIFT Payments

    U.S. Dollar Accounts for 49.1% of SWIFT Payments

    The U.S. Dollar’s Dominance in Global Payments

    Understanding SWIFT: A Global Payment Network

    The Society for Worldwide Interbank Financial Telecommunication (SWIFT) serves as a backbone for international banking, facilitating secure communications between banks across borders. This intricate web is essential for banks and financial institutions to send money to each other efficiently and accurately. Each message transmitted through SWIFT is akin to a digital telegram detailing crucial financial information, making it indispensable for modern international trade.

    The Impact of Sanctions on Russia

    In response to Russia’s actions following the invasion of Ukraine in February 2022, a significant number of Russian banks faced expulsion from the SWIFT network. This exclusion was a part of broader international sanctions aimed at curtailing Russia’s ability to engage in global trade. Consequently, the ban imposed severe limitations on Russia’s financial transactions, complicating cross-border payments and trade operations. While these sanctions made international trade more difficult for Russia, they did not fully eliminate its ability to engage in these activities.

    The U.S. Dollar: A Leading Currency in SWIFT Transactions

    Statistics indicate the U.S. dollar’s overwhelming dominance in the SWIFT payment network. As of August 2024, the dollar accounted for 49.1% of all transactions facilitated by SWIFT. This figure starkly contrasts with other currencies, where the euro held a 21.6% share, followed by the British pound at 6.5% and the Chinese yuan at 4.7%. Notably, if payments made solely within the Eurozone are excluded, the dollar’s influence rises to approximately 60%, reinforcing its status as the de facto global currency.

    The Implications of Dollar Dominance

    The staggering prevalence of the U.S. dollar in the global payment ecosystem highlights its role as an almost singular force in international trade. This situation creates opportunities for U.S. economic leverage, as the nation can exert significant influence over global financial systems. It also raises concerns among nations such as Russia and other U.S. adversaries, prompting discussions around creating alternatives to U.S.-centric financial systems.

    Russia’s Push for Alternatives in Payment Systems

    At the recent BRICS summit in Kazan, a key topic was Russia’s proposal for an alternative international payment platform. The intent of this initiative is to create a more independent financial ecosystem that lessens reliance on the U.S. dollar. Such a move aims to offer countries, especially those facing sanctions, a safer avenue for international transactions.

    Proposed New Payment Networks

    Russia’s strategy involves establishing a network of commercial banks interconnected through the central banks of BRICS member states (Brazil, Russia, India, China, and South Africa). The proposed system would facilitate token-based cross-border payments in local currencies, ultimately aiming to decrease the necessity for dollar transactions. This initiative could potentially reduce the transactional costs associated with settling international payments, providing an avenue for these countries to bolster economic cooperation and financial autonomy.

    The Future of Global Payments

    The ongoing discussions at the BRICS summit signify a pivotal moment in the evolution of international payment systems. The desire among member states to diminish the prominence of the U.S. dollar could reshape the landscape of global finance. By leveraging their combined economic strength, the BRICS nations aim to develop alternative systems that enhance their strategic financial capabilities.

    Challenges Ahead

    Despite these aspirations, the implementation of an alternative payment system will face substantial hurdles. Factors such as varying levels of economic stability, currency convertibility, and political willingness among member states will play crucial roles in determining the feasibility and success of such an initiative.

    As the world observes these developments, the ongoing tension between established financial frameworks dominated by the U.S. dollar and emerging systems highlights a critical juncture in global economic history. The dynamics of international trade and finance are on the brink of potential transformation, with consequences that could resonate far beyond the immediate interests of the BRICS nations.

  • BRICS Nations Now Represent 45% of Global Population

    BRICS Nations Now Represent 45% of Global Population

    The Rising Influence of BRICS: A New Global Paradigm

    Introduction to BRICS

    BRICS is an acronym that represents a coalition of major emerging economies, originally comprising Brazil, Russia, India, China, and later South Africa, which joined in 2010. The bloc is an influential entity on the global stage, acting as a counterbalance to Western-led organizations such as the G7. With a focus on promoting a multipolar world, BRICS emphasizes reducing the dominance of the United States and its allies, working toward a more inclusive and equitable global framework.

    Recent Expansion of BRICS

    In August 2023, BRICS underwent a significant expansion, officially inviting six additional nations to join its ranks. The countries that accepted the invitation include Egypt, Ethiopia, Iran, and the United Arab Emirates, all of which will formally join the bloc on January 1, 2024. Meanwhile, Argentina has declined the offer, while Saudi Arabia is still evaluating its potential membership. This expansion marks a pivotal moment in the organization’s history, amplifying its influence and presence worldwide.

    The Economic Footprint of Expanded BRICS

    Population and GDP Metrics

    With the integration of the new member states, the expanded BRICS now represents approximately 45% of the global population and around 35% of global GDP when measured at purchasing power parity (PPP). These figures indicate a significant concentration of economic power, positioning BRICS as a formidable player in international affairs.

    Oil Production Capabilities

    The addition of Iran and the UAE has notably bolstered BRICS’ oil production capabilities, increasing the bloc’s combined output by nearly 50%. As a result, BRICS now accounts for close to 30% of global oil production, establishing itself as a pivotal actor in the energy sector. This strategic move not only enhances the bloc’s economic leverage but also reinforces its role in global energy markets.

    Trade Dynamics within BRICS

    Despite its substantial population and economic output, BRICS’ share of global merchandise exports remains relatively modest. In the past year, the nine member nations collectively accounted for only 22% of global merchandise exports, with China contributing nearly two-thirds of that figure. This disparity highlights the challenges that BRICS faces in establishing a more balanced trading relationship among its members and on a global scale.

    The Dominance of China in BRICS

    Economic Influences

    While BRICS promotes the notion of an “equal partnership” among its member states, it is challenging to overlook China’s significant influence within the bloc. Measured at purchasing power parity, China’s GDP surpasses that of the remaining eight BRICS nations combined. This economic dominance allows China to wield considerable power in negotiations and decision-making processes within the organization.

    Political Implications

    China’s outsized role raises questions about the true nature of cooperation within BRICS. While the group aspires to represent the interests of the Global South, China’s preeminence in both economic and political spheres may overshadow the contributions and perspectives of other member states. This dynamic shows the complexities embedded in creating a cohesive and representative alliance in an increasingly competitive global landscape.

    The Vision for a Multipolar World

    South African President Cyril Ramaphosa has articulated a vision for BRICS as a representative of the Global South, focusing on addressing the needs and concerns of its people. The call for sustainable development, equitable economic growth, and reform of multilateral systems aligns with the bloc’s broader objectives. Yet, the success of these initiatives will depend on balancing the diverse interests of its members while addressing the overarching economic influence of larger players like China.

    Conclusion

    With an increasing number of member states and a growing share of global economic power, BRICS is poised to play a critical role in shaping the future of international relations. As it continues to expand its influence, the dynamics within the group and its collective objectives will be closely watched by policymakers, scholars, and global citizens alike.

  • Gen Z to Drive 46% of India’s $1.8 Trillion Spending by 2035

    Gen Z to Drive 46% of India’s $1.8 Trillion Spending by 2035

    The Rise of Gen Z in India’s Consumer Landscape

    Understanding the Gen Z Demographic in India

    Generation Z, often referred to as Gen Z, comprises individuals born roughly between the mid to late 1990s and the early 2010s. In India, this generation is a powerful force, currently accounting for around 377 million people, which translates to nearly 40 percent of the country’s total population. As countries grow, each subsequent generation tends to surpass its predecessors in both size and economic impact, and India is no exception. As this generation continues to mature, their influence on consumer behavior is becoming increasingly pronounced.

    Spending Power: Current and Projected Trends

    Despite being in the early stages of adulthood, Gen Z’s spending power in India is already displaying significant potential. Presently, their share of the consumer market stands at approximately $200 billion, making up about 10 percent of the overall market. However, projections indicate that by 2035, Gen Z is expected to dominate the consumer landscape, contributing to an astonishing 46 percent of total consumer spending in India—approximately equating to $1.8 trillion.

    Current Expenditures: Households and Influences

    Interestingly, a considerable portion of Gen Z’s impact on spending is experienced at the household level. The Boston Consulting Group and Snapchat report reveals that Gen Z household members are currently driving about $860 billion in consumer spending. This figure is testament to their active roles in family purchasing decisions, particularly in multi-generational households, which are prevalent across India.

    Key Areas of Expenditure among Gen Z

    Dining Out and Food Delivery

    Among the various categories where Gen Z’s influence is felt, dining out and food delivery services rank prominently. With the rise of food delivery apps and a burgeoning restaurant culture, this segment is rapidly gaining traction. Gen Z’s preference for convenience coupled with their social habits has made them key consumers in this domain.

    Fashion Trends

    Fashion is another pivotal area where Gen Z is carving out their influence. Known for their trend-driven approach to clothing and accessories, this generation tends to gravitate more toward emerging brands and unique styles rather than just established names. This shift signifies a change in marketing strategies, as brands need to connect more personally with younger audiences.

    Entertainment Consumption

    In terms of entertainment, Gen Z is reshaping how content is consumed. The report highlights that online video streaming platforms and out-of-home entertainment are vital aspects of their spending habits. The demand for the latest shows, music, and games is driving significant revenue within these sectors, indicating a cultural shift towards digital consumption.

    The Role of Social Influencers in Consumer Behavior

    A standout finding from the research highlights the role of social media and influencers in shaping Gen Z’s purchasing decisions. Approximately 72 percent of Gen Z Indians look to creators and influencers for shopping inspiration, a stark contrast to only 49 percent of Millennials. This trend underscores the increasing importance of social media as a marketing channel and the need for brands to incorporate influencer partnerships in their strategies.

    Gaps in Targeting Gen Z

    Despite their considerable impact, a survey among Indian brands reflected a curious oversight: many have yet to tailor their marketing efforts explicitly towards the Gen Z demographic. While the potential of this consumer segment is recognized, there is a noticeable lag in the strategic engagement of brands seeking to resonate with their values and preferences.

    Gen Z’s inclination to favor new and innovative products suggests that brands should rethink traditional marketing approaches. Emphasizing authenticity, creativity, and adaptability will be crucial as they navigate the rapidly changing landscape characterized by this young and increasingly influential audience.

  • Gen Z to Drive 30% of Spending in Africa by 2030

    Gen Z to Drive 30% of Spending in Africa by 2030

    Rising Consumer Trends in Africa and Asia by 2030

    As we look toward the future, particularly the year 2030, the landscape of consumer spending is expected to undergo significant changes. According to a comprehensive report from World Data Lab, Nielsen, and GfK, younger generations, notably Millennials and Generation Z (Gen Z), are poised to take the helm as the largest contributors to consumer expenditure across various regions, particularly in Africa and Asia.

    Millennial and Gen Z Spending Dominance

    Over the next decade, Gen Z is projected to emerge as the dominant spending generation in numerous countries in Sub-Saharan Africa, India, Pakistan, and nations such as Indonesia, the Philippines, Mexico, and Peru. Meanwhile, Millennials are forecasted to retain their position as the largest spenders in countries like China, Russia, significant portions of North Africa, the Middle East, South Africa, Australia, New Zealand, and Chile.

    Insights on Generational Spending

    The upcoming consumer spending trends indicate that these younger generations are not only willing to spend but are also equipped to shape the markets they engage with. The findings of the report suggest a demographic shift where Gen Z in developing regions, characterized by continued population growth, will wield considerable influence in the marketplace. This generation, when viewed through the lens of consumer behavior, stands out for its potential to reshuffle the traditional paradigms of spending.

    The Continued Role of Gen X and Baby Boomers

    While Gen Z and Millennials are making strides in consumer spending, Generation X (Gen X) will still play a crucial role, particularly in developed regions. By 2030, Gen X is expected to contribute the largest share of consumer spending in Europe, the United States, Canada, and parts of Latin America and Asia. Interestingly, countries such as France and Japan will see Baby Boomers maintaining their position as significant stakeholders in consumer spending.

    Economic Implications for Future Generations

    The report projects that Gen Z will be the largest, wealthiest, and highest-spending generation ever recorded. This trend is particularly pronounced in developing countries where population growth remains robust, enabling Gen Z to become a formidable purchasing force. However, contrary to popular belief, the report points out that Millennials and Gen Z are not, on average, worse off than their parents. Instead, the intergenerational progress in wealth accumulation and spending power has witnessed a deceleration.

    Spending Patterns in the Next Decade

    As per the forecasts, Gen Z will begin to allocate their spending across various essential categories. By 2024, their spending in Sub-Saharan Africa is expected to reach around 30%, mirroring Millennials. In North Africa and the Middle East, this proportion is anticipated to be about 23%, while it stands at 20.6% in Latin America and the Caribbean. The Asia Pacific region, despite its slower pace—19.3%—is projected to evolve as Gen Z navigates diverse cultural landscapes, marked by older and younger nations alike.

    Anticipated Expenditures of Gen Z

    As Gen Z matures and their disposable incomes rise, their spending habits are expected to shift significantly. Key areas of increase will include:

    Education

    Education is likely to take precedence in Gen Z’s spending as they increasingly prioritize knowledge acquisition and skill development. This focus reflects a growing understanding of the importance of higher education in securing employment opportunities in an evolving job market.

    Fashion and Lifestyle

    As fashion trends continue to evolve, Gen Z will likely allocate more towards clothing and personal expression through lifestyle choices. Their affinity for brands that align with their values will shape their purchasing decisions significantly.

    Transportation and Mobility

    With urbanization on the rise, the need for efficient transportation solutions will prompt Gen Z to invest in mobility options. This includes spending on public transportation, rideshare services, and potentially cars, depending on economic conditions and societal shifts.

    Alcohol Consumption

    As this generation comes of age, spending on alcohol is expected to rise, influenced by cultural shifts and social settings that promote adult lifestyle choices.

    Health Spending Trends

    Currently, health-related expenditures are not anticipated to be a major factor in Gen Z’s budget. However, as they grow older and begin to face new life stages, this focus may evolve, ultimately impacting healthcare industries and wellness sectors in the long run.


    By examining these emerging trends, businesses, marketers, and policymakers can strategically prepare for the transformative impact that Millennials and Generation Z are poised to have on the consumer landscape across Africa, Asia, and beyond. Through understanding the nuances of spending behavior, stakeholders can foster deeper connections with these influential demographics as they grow into their financial potential.

  • Reasons for Asian Immigration to the U.S.: Key Percentages Revealed

    Reasons for Asian Immigration to the U.S.: Key Percentages Revealed

    Understanding the Diverse Motivations of Asian Immigrants to the U.S.

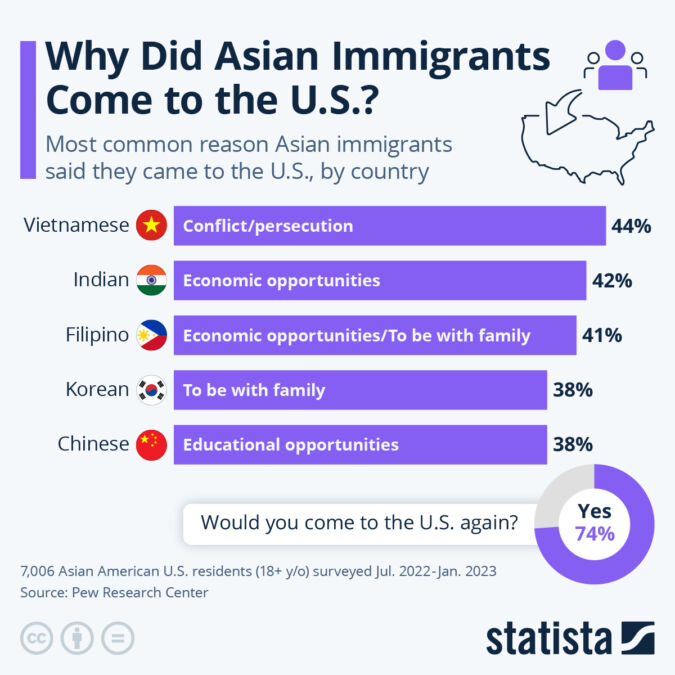
    Asian immigration to the United States has played a pivotal role in shaping the cultural and economic landscape of the nation. Each group of Asian immigrants has its own unique story and motivations for relocating to the U.S. According to a survey conducted by the Pew Research Center, these motivations can vary significantly based on country of origin. Let’s delve deeper into the reasons why immigrants from different Asian nations have chosen the United States as their new home.

    Chinese Immigrants: A Pursuit of Education

    Chinese immigrants constitute one of the largest groups within the Asian immigrant population in the U.S. The survey revealed that 38% of Chinese respondents cited educational opportunities as their primary reason for immigrating. This aligns with data showing that Chinese nationals represent the highest number of foreign students in the United States.

    Family Connections

    Interestingly, 31% of Chinese immigrants reported that reuniting with family played a significant role in their decision to move to the U.S. Family ties remain a strong motivating factor, indicating that for many, personal connections are just as compelling as professional aspirations.

    Indian Immigrants: Economic Opportunities at the Forefront

    In contrast to their Chinese counterparts, 42% of Indian immigrants reported that economic opportunities were their main motivation for coming to the U.S. This highlights a critical aspect of the Indian immigrant experience, where the promise of jobs and financial stability serves as a primary lure.

    Educational Aspirations

    Despite the focus on economic factors, 29% of Indian respondents indicated that they also pursued educational opportunities in the U.S. This dual interest in both education and employment underscores the complexities of the Indian diaspora and its varied aspirations.

    Filipino Immigrants: Family and Economic Factors

    Filipinos represent a significant immigrant group in the U.S., often noted for their resilience and rich cultural heritage. The survey found that 41% of Filipino immigrants cited economic opportunities as their reason for moving, paralleling trends observed in other Asian immigrant groups.

    Reuniting with Family

    Equally important, 41% of respondents mentioned that family connections influenced their immigration decision. This shows a notable pattern across various Asian communities: the desire to maintain familial relationships is often as important as seeking economic gain.

    South Korean Immigrants: Family and Education

    The motivations for South Korean immigrants differ slightly, with 38% stating that they came to be with family. This prioritization of family ties reflects longstanding historical connections between South Korea and the U.S., particularly after the Korean War.

    Educational Opportunities

    28% of South Korean immigrants indicated that educational opportunities were another critical reason for their move. This suggests that South Koreans are also focused on leveraging the robust educational system in the U.S. for their personal and professional growth.

    Vietnamese Immigrants: Escaping Conflict and Persecution

    The motivations of Vietnamese immigrants are often shaped by historical events, particularly the aftermath of the Vietnam War. The survey indicated that 44% of Vietnamese respondents cited escaping conflict and persecution as their primary reason for coming to the U.S.

    Family Considerations

    Additionally, 29% of Vietnamese immigrants mentioned family reunification as a pivotal factor. This reveals a dual motivation framework where survival and family connections intersect to drive immigration decisions.

    Overall Sentiments Among Asian Immigrants

    The survey also highlighted a few notable sentiments shared amongst Asian immigrants as they reflect on their experiences in the United States. Almost 75% of respondents indicated that they would choose to immigrate to the U.S. again, though this sentiment varies across different groups. For instance, only 66% of Indian immigrants expressed similar enthusiasm, with a notable 15% stating they would prefer to remain in their home country, a sentiment less prevalent among other immigrant groups.

    Perceptions of Standard of Living

    A significant finding was that about 75% of surveyed immigrants believed they enjoyed a better standard of living than their parents. This speaks to the aspirations that drive many to seek better lives abroad. However, there is a nuanced view regarding the future; only around 50% felt that their children would have a better standard of living than they do. This raises questions about the socio-economic conditions and evolving challenges faced by immigrant families across generations.

    Cultural Values and Opportunities

    Across the different Asian immigrant groups surveyed, there was a common sentiment regarding the strengths of familial ties in their home countries versus the opportunities available in the U.S. Most acknowledged that while family connections may be stronger back home, the U.S. is perceived as a land of opportunity offering advantages in terms of freedom of speech, gender equality, and conducive conditions to raise children.

    This intricate tapestry of motivations and sentiments reflects the diverse experiences of Asian immigrants in the U.S., capturing a multitude of factors that contribute to their decision-making processes. Understanding these dynamics offers a richer perspective on the significance of immigration in shaping American society and highlights the unique challenges and aspirations of various immigrant communities.

  • H1: Race-Related Hate Crimes Hit 5,900 in the U.S. (2023)

    H1: Race-Related Hate Crimes Hit 5,900 in the U.S. (2023)

    The Alarming Rise of Hate Crimes in the U.S. in 2023

    Hate crimes, defined as criminal offenses motivated by bias or prejudice against particular groups, have seen an unsettling surge in the United States in 2023. The Federal Bureau of Investigation (FBI) has reported that a significant majority of these incidents are motivated by race, ethnicity, or ancestry. A closer examination of the data reveals concerning trends in different categories of hate crimes, indicating that societal divisions and tensions continue to manifest in violent ways.

    Overview of Hate Crimes Statistics in 2023

    According to the latest figures, 2023 witnessed a total of 11,862 hate crime incidents across the nation, with 5,900 of these incidents specifically categorized as racially motivated. This statistic represents a significant portion of the overall hate crime landscape, highlighting a persistent issue that continues to affect marginalized communities throughout the U.S.

    Breakdown of Racially Motivated Hate Crimes

    A deeper dive into the statistics shows that hate crimes targeting individuals based on race, ethnicity, and ancestry accounted for the largest share of reported incidents. Here are some key points:

    • Anti-Black or African American Hate Crimes: This category alone accounted for 3,027 incidents, solidifying its status as the most prevalent type of single-bias hate crime.
    • Emerging Trends in Other Ethnic Groups: Notably, hate crimes against Arab and Latino individuals were the only racial or ethnic groups that observed a rise in incidents from 2022 to 2023, suggesting an emerging threat that needs to be addressed.

    Religion-Based Hate Crimes

    Following race, religious bias emerges as the second-largest motivation behind hate crimes. In 2023, this category included a range of incidents targeted at various faith communities:

    • Anti-Jewish Incidents: A staggering 1,832 incidents of hate were reported, marking 2023 as the worst year on record for anti-Jewish hate crimes since the FBI began tracking such data in 1991.
    • Anti-Muslim and Anti-Sikh Cases: There were 236 incidents related to anti-Muslim sentiments, reaching the fifth highest year on record, along with 156 incidents targeting Sikhs. This underlines the idea that religious identity is increasingly becoming a focal point for hate crimes in America.

    Hate Crimes Based on Sexual Orientation

    Another area of concern is the rise in hate crimes motivated by sexual orientation. In 2023, the FBI recorded 2,077 incidents of such crimes, reflecting a 7% increase from the previous year. This upward trend necessitates heightened awareness and advocacy for the LGBTQ+ community, as it suggests a growing climate of hostility.

    Limitations of the Current Data

    While the FBI’s data offers valuable insights, experts warn that these numbers may not fully encapsulate the reality of hate crimes in the U.S. The Arab American Institute has pointed out several limitations in the data reporting system:

    • Underreporting Issues: Many agencies still do not participate in the National Incident-Based Reporting System (NIBRS), resulting in gaps in data that could paint a more comprehensive picture of hate crimes.
    • Changes in Reporting Systems: Modifications in how hate crimes are categorized and reported may also contribute to inconsistencies in the data, complicating efforts to gauge the full extent of the problem.

    Conclusion

    As the data suggests, the landscape of hate crimes in the United States is complex and multifaceted. The increasing prevalence of racially and religiously motivated violence warrants urgent discussions about systemic issues that perpetuate these biases. Addressing the limitations in reporting can further enhance understanding and response to hate crimes, shaping a more inclusive and safe environment for all citizens.

  • Hate Crimes in the U.S. Rose 2% in 2023: Over 11,800 Reported

    Hate Crimes in the U.S. Rose 2% in 2023: Over 11,800 Reported

    Analyzing the Rise of Hate Crimes in 2023: A Comprehensive Overview

    Understanding Hate Crimes

    A hate crime, as defined by the FBI, is a crime motivated by bias against particular characteristics, including race, color, religion, national origin, sexual orientation, gender, gender identity, or disability. This broad categorization highlights the multifaceted nature of hate crimes, which can manifest in various forms ranging from verbal harassment to violent acts.

    The Latest Statistics: A Two-Year Comparison

    In 2023, the FBI reported over 11,800 hate crime incidents, marking a 2% increase from the 11,634 incidents recorded in 2022. This uptick signals a troubling trend in the frequency of these offenses, particularly in a time of social and political unrest.

    Yearly Breakdown of Hate Crime Incidents

    • 2023: 11,862 incidents
    • 2022: 11,634 incidents

    The contrast between these years reveals a growing concern that needs to be addressed, particularly as communities continue to grapple with prejudice and bias.

    Historical Perspective: Trends Over Time

    The statistics from the FBI reveal a deeper narrative within the landscape of hate crimes. Following the aftermath of 9/11 in 2001, there was a significant spike in hate crime incidents, after which a decline occurred in the early 2000s. However, recent years have seen a resurgence, particularly notable during the 2019-2020 period.

    Specific Increases in Hate Crimes

    • Asian American Hate Crimes: A staggering 73% increase was recorded, rising from 161 reported cases in 2019 to 279 in 2020.
    • Anti-Black or African American Hate Crimes: This category remained the largest, with 2,871 incidents reported in 2020—a rise of 49% from the previous year.

    This historical data emphasizes the cyclical nature of hate crimes in the U.S., often influenced by socio-political events and community reactions to them.

    Broader Context: Crime Trends in 2023

    Interestingly, while hate crimes have risen, other categories of crime have seen declines during the same period year-over-year. The 2023 statistics highlight:

    • Murder Cases: Down by 11.6%
    • Rape Cases: Decreased by 9.4%
    • Aggravated Assault: Reduced by 2.8%
    • Robbery: Down by 0.3%

    Property Crime Trends

    In terms of property-related crimes:

    • Burglary: Decreased by 7.6%
    • Larceny: Fell by 4.4%
    • Motor Vehicle Theft: Contrarily, there was a 12.4% increase in reported incidents

    The juxtaposition of rising hate crimes against the backdrop of declining other crime categories underscores a growing societal issue.

    Implications of Data Interpretation

    One critical aspect of analyzing these statistics involves the methodology used by the FBI in reporting. Since 2021, the FBI has been transitioning to the National Incident-Based Reporting System (NIBRS), which is not uniformly adopted across all law enforcement agencies. This inconsistency necessitates caution in interpretation.

    Regular Reporting Concerns

    According to the FBI, if we focus solely on agencies that report consistently, there was a slight decline of 0.6% in hate crime cases from 10,687 in 2022 to 10,627 in 2023. This suggests that while the overall picture shows an increase, nuances exist within the data that can lead to varied interpretations.

    Conclusion

    The rising numbers of hate crimes juxtaposed against declining overall crime rates in 2023 paint a complex picture of societal challenges. Examining these statistics requires careful analysis, taking into account the shifts in reporting methods and historical context. There is an urgent need for communities and policymakers to address the underlying issues driving hate crimes and foster a more inclusive society.

  • Top Immigrant Origins: Countries Shaping Global Migration

    Top Immigrant Origins: Countries Shaping Global Migration

    Understanding Global Migration Patterns: A Closer Look at Immigrant Origins

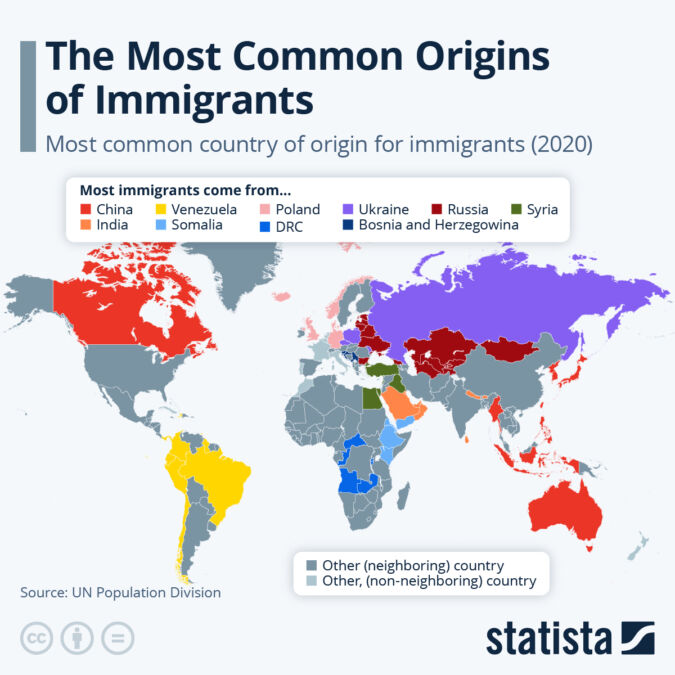
    The dynamics of immigration are complex and influenced by various factors, including socio-economic conditions, political stability, and geographic proximity. The data derived from the United Nations Population Division paints a vivid picture of the most common origins of immigrants, showcasing the interconnectedness of nations through migration.

    The Influence of Geographic Proximity

    One of the most striking observations from the immigration data is the tendency for neighboring countries to be the primary sources of immigrants. This phenomenon is evident in several key regions around the world.

    Case Studies in Neighborly Immigration

    • United States and Mexico: A classic example of bilateral immigration, with Mexicans being the largest group of immigrants in the U.S. and vice versa. This movement reflects historical ties and economic interdependencies between the two nations.

    • Albania and Greece: The migrations between these countries highlight the economic opportunities sought by Albanians in Greece, where many have settled to work and live.

    • Honduras and El Salvador: Both countries experience significant cross-border migration, driven by social and economic factors, as well as political challenges.

    The Impact of Conflict and Economic Collapse

    While many migration patterns follow geographic lines, the landscape shifts dramatically in times of crisis. Countries facing conflict, war, or economic devastation often see mass emigrations.

    Examples of Crisis-Induced Migration

    • Venezuela: The ongoing economic crisis has led to mass migrations, with Venezuelan immigrants now forming the largest group in neighboring countries such as Colombia, Brazil, and Peru.

    • Democratic Republic of the Congo (DRC): Due to prolonged conflict and instability, many Congolese have sought refuge in neighboring nations, with significant numbers in Uganda and Rwanda.

    • Somalia: Similarly, Somalia has witnessed a large-scale outflow of its citizens to surrounding countries like Kenya and Ethiopia, driven primarily by instability and famine.

    • Ukraine: The crisis in Ukraine has resulted in a substantial number of Ukrainians seeking refuge in neighboring countries like Poland and Romania, illustrating how geopolitical events can reshape the map of migration almost overnight.

    Global Migration Networks

    In addition to neighboring countries, some nations have established extensive networks that send immigrants across the globe, regardless of proximity.

    Prominent Global Sources of Immigrants

    • India: Known for its significant diaspora, Indian immigrants can be found across the Arabian Gulf, as well as in countries like the United States, Canada, and Australia. The motivation for these migrations often includes better economic opportunities and higher standards of living.

    • China: Similar to India, China has a vast immigrant population, with Chinese people being a prominent group in both neighboring Asian countries and Western nations such as Canada and Australia.

    • Poland: Polish immigrants have made their mark in countries like the United Kingdom and Germany. Economic opportunities in these nations have attracted significant numbers of Poles over the years.

    Unique Immigration Partnerships

    While many countries primarily see immigrants from neighboring states, a few exhibit immigration patterns influenced by their historical ties through colonization or other unique circumstances.

    Examples of Unique Immigration Relationships

    • Equatorial Guinea and Morocco: The primary source of immigrants in these nations is France, showcasing the lasting impacts of colonial history.

    • The Netherlands and Suriname: This relationship highlights the colonial past, with many Surinamese choosing to move to the Netherlands for better opportunities.

    • Portugal and Angola: Similarly, Angolans have historical connections to Portugal that continue to influence migration patterns today.

    Colonial Legacies and Their Impact on Migration

    Colonial history plays a substantial role in shaping modern immigration patterns. Countries that were once colonial powers often maintain significant ties to their former colonies, resulting in unique immigrant relationships.

    Case Studies of Colonial Influence

    • France and Algeria: The long-standing ties between France and Algeria have resulted in a significant Algerian immigrant population in France.

    • Cuba and Spain: Historical connections have also led to a considerable number of Cubans migrating to Spain, driven by cultural ties and shared history.

    • New Zealand and the United Kingdom: New Zealand maintains strong connections with the UK, resulting in a notable population of British immigrants.

    Through the lens of immigration patterns, we can gain insights into the interconnectedness of our global society, driven by a blend of proximity, historical relationships, and contemporary crises. Understanding these dynamics not only sheds light on the movement of people across borders but also highlights the socio-economic factors that drive individuals and families to seek new opportunities away from their homeland.

  • Gen Z: 2 Billion Strong, 19% of Global Consumer Spending by 2030

    Gen Z: 2 Billion Strong, 19% of Global Consumer Spending by 2030

    The Rise of Generation Z: A New Era of Consumer Power

    Understanding Generation Z

    Generation Z, typically defined as individuals born from the mid-to-late 1990s through the early 2010s, is poised to become a monumental force in the global economy. This generation is not only notable for its size but also for its economic potential. According to insights from World Data Lab, Nielsen, and GfK, Generation Z is expected to emerge as the wealthiest and highest-spending generation in history. This demographic shift signals a significant transition in consumption patterns, influencing markets across the globe.

    Demographics and Global Influence

    Size Matters

    By 2024, Generation Z is projected to comprise nearly 25% of the world’s population, marking them as the largest generation. This growth is particularly pronounced in developing and middle-income countries, where population trends have remained robust. As the global average age shifts, marketers and businesses must consider how to engage this substantial segment of consumers effectively.

    Distribution Across Regions

    • Sub-Saharan Africa: Noted for its rapid growth, Sub-Saharan Africa is witnessing Generation Z emerging as a dominant consumer group. By 2030, their spending is expected to account for around 30% of the consumer market, matching that of Millennials in the region.

    • Latin America and Asia-Pacific (APAC): These regions are also experiencing noteworthy growth, with Generation Z projected to account for roughly 20% of consumer spending. This is comparable to the estimated spending of Millennials and Gen X in these areas.

    • Europe and North America: Contrastingly, in Europe and North America, the economic impact of Generation Z will be more modest. By 2030, their consumer spending will constitute about 15% of the market. Here, the financial power remains in the hands of Gen X and Baby Boomers, who will collectively retain over half of the consumer spending.

    Economic Positioning of Generation Z

    Wealth Accumulation Trends

    Despite a slower rate of wealth accumulation compared to previous generations, Generation Z is anticipated to have a significant economic standing as they transition into adulthood. Current estimates suggest that the average Gen Z individual will possess more wealth than Millennials at similar life stages, underscoring a crucial transformation in wealth dynamics.

    Spending Projections

    As Gen Z comes of age, their share of global consumer spending is expected to rise rapidly:

    • In 2023, Generation Z’s spending contribution is estimated at around 17%.
    • By 2030, this figure is projected to increase to approximately 19%, although they will still trail behind the spending patterns of Millennials and Gen X at that time.

    Regional Variations in Consumer Behavior

    Different regions are expected to exhibit varying levels of purchasing power and spending habits among Generation Z, influenced by local economic conditions, cultural factors, and societal norms.

    Sub-Saharan Africa: A Growth Hotspot

    With a youthful demographic profile, Sub-Saharan Africa is witnessing Generation Z emerge as key economic agents. The region’s growth in consumer spending is driven by a dynamic combination of increasing internet penetration, mobile adoption, and an overall youthful population eager to engage with brands and services.

    Latin America and APAC: Emerging Markets

    In Latin America and APAC, Generation Z is beginning to shape consumer culture. Their inclination towards digital platforms and social media has led to unique spending patterns that prioritize experiences, technology, and sustainability. This generation is not just spending; they are consciously aligning their purchases with personal values and ethics.

    Europe and North America: Gradual Engagement

    In contrast, Europe’s and North America’s economic landscapes are characterized by slower growth. Generation Z’s spending power in these regions reflects muted economic activity and more entrenched consumer behavior from older generations. However, as this demographic continues to engage with the market, brands must adapt their strategies to resonate with their unique preferences and values.

    Strategic Insights for Businesses

    Understanding the behavior and potential of Generation Z is essential for businesses aiming to capture this lucrative market segment. Companies must consider the following strategies:

    • Embrace Digitalization: Ensure a strong online presence since Generation Z is digital natives who prioritize online interactions.

    • Focus on Sustainability: Highlight sustainable and ethical practices, as this is a key consideration for Gen Z consumers.

    • Engage Through Values: Brands should ensure their messaging aligns with the values and social consciousness of Generation Z to foster loyalty and connection.

    • Adapt Marketing Strategies: Tailor marketing approaches to resonate with the distinct preferences of Generation Z, utilizing platforms and communication methods that are most effective with this audience.

    By recognizing and embracing the unique characteristics of Generation Z, businesses can position themselves effectively for future growth in a rapidly evolving marketplace.

  • 2 in 3 People Encounter Hate Speech Online Regularly

    2 in 3 People Encounter Hate Speech Online Regularly

    Understanding the Prevalence of Hate Speech Online

    In recent times, the internet has become a double-edged sword—a platform for free expression and a breeding ground for hate speech. A comprehensive survey by Ipsos, conducted between August 2022 and September 2023, sheds light on this troubling trend, revealing that two in three people often encounter hate speech online. This discussion will delve into the context of these findings, explore the countries most affected, and examine public sentiment regarding the regulation of online hate speech.

    The Ipsos Survey: An Overview

    The Ipsos survey included a significant participant base of 8,000 individuals across 16 countries, primarily those bracing for national elections in 2024. This strategic selection not only highlights the political climate but also emphasizes the potential link between elections and the surge of hate speech and disinformation online.

    Countries Most Affected by Hate Speech

    The data reveals staggering statistics regarding the frequency of encountered hate speech.

    India: A Troubling Statistics

    A staggering 85% of respondents in India reported frequently encountering hate speech. This figure underscores the alarming rate at which negative online rhetoric proliferates in the region, reflecting deeper societal issues that merit attention.

    Bangladesh: A Close Contender

    Following closely are respondents from Bangladesh, where 84% reported encountering similar sentiment online. This high percentage raises significant questions about the social dynamics and digital culture prevailing within the country.

    South Africa: A Unique Context

    In South Africa, 79% of surveyed individuals indicated that they often encountered hate speech online. The dynamics in South Africa might be influenced by historical themes of racial tension, and the digital space may be acting as a new arena for these age-old struggles.

    The Situation in the United States

    The survey also included data from the United States, where the encounter rates for hate speech showcased a different picture.

    Frequency of Encounters

    While only 18% of respondents claimed to see hate speech online "very often," a notable 37% indicated they encountered it "fairly often." This brings the total to an alarming 55% of Americans who are regularly exposed to hate-driven content, emphasizing the pervasive nature of discrimination in digital communication.

    Platforms as Hotbeds for Hate Speech

    According to the survey data, social media platforms are often perceived as significant conduits for hate speech and disinformation.

    Facebook: The Predominant Platform for Hate Speech

    Approximately 60% of respondents believed that hate speech and disinformation are most widespread on Facebook. Given that Facebook is one of the largest social networking sites globally, this perception calls into question the platform’s moderation policies and their effectiveness in curbing harmful content.

    TikTok: A Rising Concern

    TikTok, while relatively new compared to Facebook, was cited by 30% of respondents as a platform where hate speech is prevalent. This reflects TikTok’s rapid rise in popularity among younger demographics and suggests a need for increased monitoring and regulation.

    The Role of X/Twitter

    At the time of the survey, 18% of respondents identified X (formerly Twitter) as a platform where hateful content prevails. This statistic aligns with the platform’s long-standing challenges in effectively managing hate speech, particularly during high-stakes political moments.

    Public Sentiments on Regulation

    The survey also probed public opinion on how best to tackle the issues surrounding online hate speech and disinformation.

    The Call for Government Action

    An overwhelming 90% of respondents across the surveyed countries agreed that governments should have the authority to mandate social media platforms to implement trust and safety measures during election campaigns. This statistic reveals a collective yearning for regulatory frameworks aimed at ensuring the integrity of democratic processes in the digital age.

    The Role of Social Media Platforms

    Furthermore, nine in ten individuals asserted that social media companies should actively combat misinformation and “fake news” during electoral cycles. This indicates a growing demand for accountability among private tech giants to protect users from harmful content.

    Support for International Oversight

    A notable 75% of respondents expressed the belief that international organizations, such as the United Nations, should play a significant role in addressing disinformation and hate speech. This perspective suggests a broader understanding of the global implications of online hate and a desire for coordinated international responses.

    Conclusion

    This section is intentionally left blank as requested. We aim to foster further discussion on the critical issue of online hate speech without reaching a premature conclusion.

  • U.S. Retail Sales Rise 0.4% Despite Inflation Pressures

    U.S. Retail Sales Rise 0.4% Despite Inflation Pressures

    U.S. Retail Sales Show Resilience Amid Inflation

    Overview of Recent Consumer Spending Trends

    Despite ongoing inflation challenges, U.S. retail sales demonstrated unexpected growth in September, highlighting the persistent demand among consumers. According to the U.S. Census Bureau’s advanced estimates, total retail and food services sales—encompassing expenditures at various retail establishments, online platforms, and dining outlets—reached a remarkable $714.4 billion in September. This marks a 0.4% increase from the previous month and indicates a noticeable uptick from August’s modest 0.1% gain.

    Year-on-Year Sales Comparisons

    The trend of rising retail sales is further emphasized when analyzing year-over-year data. Between July and September 2024, retail sales increased by 2.3% compared to the same period last year. This consistent growth suggests that the U.S. economy remains robust, resisting the pull of recession, largely due to the resilience in consumer spending. Given that consumer expenditures comprise approximately 70% of the nation’s Gross Domestic Product (GDP), the steady purchasing behavior of Americans plays a crucial role in underpinning economic stability.

    Inflation Versus Retail Sales: A Closer Look

    In September, consumer prices increased by just 0.2%. The significance of this development cannot be overstated: retail sales growth outpaced inflation, implying that consumers increased their spending relative to August. Year-over-year comparisons reveal a 1.9% growth in retail sales relative to September 2023, albeit with a slight 0.5% decline when measured in constant 1982-1984 dollars. This illustrates a complex picture of consumer behavior, where nominal spending may rise while real purchasing power flattens.

    Analyzing the Relationship Between Prices and Spending

    An essential aspect of understanding the recent retail sales data is recognizing that the reported increases largely stem from rising prices rather than expanded consumer activity. Between September 2021 and September 2024, retail and food service sales rose by an impressive 15.1%. However, once adjusted for the Consumer Price Index (CPI) inflation, the increase in sales becomes negligible, only totaling a 0.2% rise over the past three years. This flatlining of sales when adjusted for inflation indicates a significant trend: consumers are purchasing similar quantities of goods despite experiencing escalating prices.

    Navigating Price Constraints

    Such data highlights how consumers have managed to adapt their spending habits amid pervasive price hikes. While people are indeed spending more, many are compelled to adjust their behaviors, which could involve opting for lower-priced alternatives or cutting back on non-essential purchases.

    Consumer Confidence and Economic Outlook

    The resilience in retail sales reflects a broader consumer confidence that seems to persist despite negative economic signals on the horizon. As long as consumers maintain their propensity to spend, the U.S. economy is likely to exhibit continued robustness. This phenomenon shows how integral consumer behavior is to mitigating the potential risks posed by a high-inflation environment and uncertain overall economic conditions.

    By continuously monitoring retail sales and consumer spending patterns, analysts can gain crucial insights into the state of the economy and the potential for future growth or setbacks.

  • 34% Suffer from Chronic Mental Health Issues in the U.S.

    34% Suffer from Chronic Mental Health Issues in the U.S.

    Understanding the Link Between Chronic Health Issues and Mental Health

    Chronic health issues significantly impact individuals’ lives, and an increasing body of research highlights the intricate relationship between physical health and mental well-being. A recent survey conducted by Statista Consumer Insights revealed that a substantial proportion of people in the United States live with chronic conditions, many of which are intricately intertwined with mental health disorders.

    The Landscape of Chronic Conditions

    According to the survey data, a majority of participants reported experiencing some form of physical limitations or chronic illness. This statistic is striking, indicating that chronic health issues are not just isolated incidents but rather a widespread issue that affects many aspects of daily life.

    Prevalence of Mental Illness

    Among the chronic conditions reported, mental illnesses were notably prevalent, with 34% of respondents identifying symptoms of burnout or depression. This high prevalence underscores the critical need to address mental health as a vital component of overall health. The stigma surrounding mental illness often hinders timely treatment and understanding, making public awareness essential.

    Cardiovascular Diseases: A Hidden Connection

    Following mental health issues, the survey highlighted cardiovascular diseases as the second most common chronic condition, reported by 15% of respondents. There is a well-established link between cardiovascular health and mental well-being. Stress, anxiety, and depression can all exacerbate cardiovascular issues, while heart conditions can agitate mental health problems, leading to a detrimental cycle of health decline.

    Diabetes and Respiratory Diseases

    The prevalence of diabetes and respiratory diseases is also worthy of note. While the survey did not specify exact percentages, both conditions are lightsportant matters that can significantly affect a person’s quality of life and mental state. Individuals coping with diabetes often face emotional challenges, including fear related to their condition and lifestyle limitations. Similarly, respiratory diseases can lead to feelings of panic or anxiety due to breathing difficulties, further impacting mental health.

    Sensory Impairments in the Context of Chronic Health Issues

    The survey also pointed to the impact of sensory impairments, such as blindness and vision impairment, which affected 10% of participants. This group’s numbers were encouragingly significant compared to the respondents experiencing deafness or hearing loss, which stood at a lower percentage.

    The Mental Toll of Sensory Impairments

    Living with sensory impairments can lead to feelings of isolation, decreased autonomy, and depression. The challenges faced in everyday life can exacerbate existing mental health issues and create new emotional difficulties, emphasizing the need for a holistic approach to care that includes physical and mental health considerations.

    The Need for Integrated Care

    The interplay between chronic health issues and mental health is evident in the statistics presented by Statista. This relationship calls for an integrated approach to health care, where healthcare providers not only address physical ailments but also consider the mental health of their patients.

    Strategies for Improved Outcomes

    1. Regular Screening for Mental Health: Healthcare professionals should routinely screen patients with chronic conditions for mental health issues, ensuring early detection and intervention.

    2. Holistic Treatment Plans: Treatment plans should incorporate mental health services alongside traditional medical care, offering support and resources to manage emotional well-being.

    3. Patient Education: Increasing awareness among patients regarding the links between chronic health conditions and mental health can empower them to seek help for both spheres of their health.

    4. Support Groups: Establishing support networks for patients with similar chronic conditions can improve emotional support and reduce feelings of isolation.

    5. Community Resources: Facilitating access to community resources, including counseling and rehabilitation services, can greatly benefit those struggling with both chronic health issues and poor mental health.

    By addressing both physical and mental health needs comprehensively, we can improve overall health outcomes for individuals living with chronic issues. The data from Statista serves as a powerful reminder of the complex relationship between different aspects of health, highlighting the importance of prioritizing mental well-being in discussions surrounding chronic illness.

  • Netflix’s Operating Margin Soars to 30% in Q3 2024

    Netflix’s Operating Margin Soars to 30% in Q3 2024

    Netflix’s Impressive Growth and Profit Margin Improvement

    As a titan of the streaming industry, Netflix continues to impress with not only its growing membership base but also its remarkable financial performance. With more than 280 million paid subscribers at the end of the previous quarter, Netflix has positioned itself as a leader in the world of digital entertainment. This growth has not gone unnoticed by investors, particularly as the company reports significant improvements in its operating margins.

    Understanding Operating Margins

    Operating margin is a vital indicator of a company’s financial health, representing the proportion of revenue that remains after covering operating expenses. A higher operating margin indicates that a company retains more profit from each dollar of revenue. For Netflix, which has previously faced concerns regarding its profitability due to massive investments in content, the recent rise in operating margins signals a turnaround in its financial strategy.

    Recent Financial Performance

    In the third quarter of 2024, Netflix’s operating margin surged by 8 percentage points, reaching nearly 30 percent. This increase is a substantial rise from 21 percent in 2023 and reflects a broader long-term trend of improving profitability. The company aims to achieve an operating margin of 27 percent for the entire year, emphasizing the effectiveness of its strategic investments and business scaling.

    Strategic Investments and Cost Management

    Netflix’s impressive margin growth can be attributed to its ability to balance significant investment in content against an ever-expanding revenue base. In contrast to its historical approach, where aggressive spending combined with high operating expenses raised concerns among investors, the current strategy illustrates a more disciplined approach to content expenditure.

    As Netflix grows, its ability to negotiate better rates with suppliers, leverage its vast subscriber base for economies of scale, and spread fixed costs over a larger revenue pool has become central to its financial model. This shift allows Netflix not only to invest in quality content but also to maintain profitability, reassuring shareholders of its commitment to long-term success.

    CFO Insights on Future Growth

    During a recent earnings call, Netflix’s CFO Spencer Adam Neumann expressed confidence in the company’s future prospects. He indicated that there is ample opportunity for margin improvement in the years to come, stating, "We see plenty of room to increase our margins over the long term. And we feel great about what we’re delivering in ’24." This statement underlines Netflix’s vision of sustained growth, focusing on balancing investment with profitability.

    Neumann reassured investors by delineating that while the margin growth may fluctuate annually based on various strategic opportunities, the overarching goal is to achieve consistent increases year over year. This forward-looking perspective is crucial for shareholders, as it highlights Netflix’s commitment to a strategically sound financial roadmap.

    Long-Term Outlook for Shareholders

    With a clear pathway toward enhanced profitability and a strong subscriber foundation, Netflix’s long-term outlook appears positive. The company’s dedication to refining its operational efficiency, alongside its continued investments in original content, points to an optimistic trajectory for both revenue and profit margins. Shareholders can take solace in the notion that Netflix is not only focused on growth but is also committed to cultivating a more resilient business model.

    In an industry marked by rapid fluctuations and evolving consumer preferences, Netflix’s ability to adapt and scale its business while improving financial metrics is a testament to its strategic foresight and execution. As the streaming landscape continues to evolve, Netflix remains a pivotal player, positioned well for future success.

  • 39% of Couples Now Meet Online: A Growing Trend

    39% of Couples Now Meet Online: A Growing Trend

    The Evolution of Modern Dating: How Couples Meet Today

    In an age dominated by technology, the way people form romantic relationships has undergone a remarkable transformation. This blog explores the changing dynamics of how couples meet, focusing on the shift from traditional methods to online dating platforms.

    The Rise of Online Dating

    Historical Context

    Before diving into the current trends, it’s important to understand the foundations of dating. Historically, most couples met through social circles, workplaces, or educational institutions. However, starting in the late 20th century, this landscape began to shift dramatically.

    The Data Surge

    Research conducted by Stanford University reveals significant changes in how heterosexual couples find their partners. Between 1995 and 2017, the percentage of individuals meeting their partners online skyrocketed from just 2% to an impressive 39%. This shift signifies a growing preference for digital interactions over traditional meetings.

    The Online Dating Landscape

    Popular Dating Apps

    With the introduction of dating apps like Tinder and eHarmony, the online dating culture has expanded beyond mere websites. These platforms allow users to connect with potential partners based on mutual interests and preferences, effectively broadening their dating pool.

    Social Media Influence

    In addition to dedicated dating apps, social networking sites such as Facebook have played a role in meeting potential partners. Approximately 8% of couples who met online did so through reconnections with old friends or acquaintances, showcasing the diverse avenues available for forming relationships today.

    The Appeal of Online Connections

    A Larger Pool of Choices

    One of the primary motivations for seeking partners online is the availability of a wider array of options. Unlike traditional settings, where individuals are limited to their immediate social circles, online dating offers the chance to explore relationships beyond geographical and social constraints. Participants in the Stanford study noted that this expanded selection was particularly valuable when searching for something non-conventional or difficult to find.

    New Encounters

    The research highlighted that the majority of online daters (around 81%) meet individuals outside their existing networks, allowing for more unique and varied connections. This element of surprise and novelty contributes to the popularity of online dating.

    Changing Venues: Bars and Restaurants

    The Rise of Social Venues

    Interestingly, the study also indicated that meeting partners in bars or restaurants has been on the rise during the same timeframe. This suggests a dual trend where both online and offline methods coexist, allowing individuals to choose the platform that suits them best.

    Implications for Different Communities

    Exclusion of Sexual Orientation in Research

    It’s essential to note that the Stanford study focused exclusively on heterosexuals. The researchers acknowledged that, for homosexual individuals, the choice to meet online may be more obvious due to the often limited dating markets they navigate. This distinction emphasizes the varied experiences and options available depending on sexual orientation.

    Thick Dating Markets

    In the context of "thick dating markets," individuals typically have more potential partners available in their offline lives. This reality contrasts with those who may rely heavily on online dating due to a lack of options in their immediate social circles.

    The Future of Dating

    As dating continues to evolve, understanding these trends is crucial. The blend of online and offline interactions may shape the romantic landscape for years to come, paving the way for new norms in how couples forge relationships.

    In summary, the evolution of dating from traditional meetings to the digital realm reflects broader societal changes. As individuals embrace technology for connection, the landscape of love and relationships continues to adapt and grow.

  • 80% of EU Hoteliers Use Multiple Marketing Channels

    80% of EU Hoteliers Use Multiple Marketing Channels

    The Power of Choice: Marketing and Distribution Strategies of EU Hoteliers

    The hospitality industry in Europe is navigating through dynamic and competitive landscapes. Hoteliers have to adopt varied marketing and distribution strategies to ensure visibility and attract a diverse range of customers. According to recent findings, European accommodations utilize a mix of marketing tools and distribution channels to optimize their reach and profitability.

    The Landscape of European Accommodations

    European hoteliers face a unique set of challenges and opportunities. From diverse customer preferences to different regulations across countries, the hospitality segment is ever-evolving. Understanding the driving factors behind their marketing and distribution strategies can provide valuable insights into the industry’s current state.

    Key Statistics on Marketing Strategies

    One of the most revealing insights from recent data is that a significant 80% of European accommodations use multiple marketing tools. This statistic underscores the necessity of diversification in approaches to attract guests.

    Popular Marketing Tools Employed

    1. Social Media Campaigns: Utilizing platforms like Instagram and Facebook to showcase properties and promote special offers effectively captures attention.

    2. Search Engine Optimization (SEO): Improving online visibility through SEO allows hoteliers to reach potential customers actively searching for lodging options.

    3. Email Marketing: Hoteliers often leverage email campaigns to keep previous and prospective guests informed about new offerings and promotions.

    4. Content Marketing: Producing informative and engaging content through blogs and articles can enhance brand perception and trust among potential guests.

    The Role of Distribution Channels

    In addition to effective marketing, distribution strategies play a vital role in how hotels reach their customers. A staggering 68% of hoteliers focus on owning their own distribution channels.

    Advantages of Direct Distribution Channels

    1. Control Over Pricing: Owning direct channels enables hotels to set competitive rates without having to share revenue with third-party booking platforms.

    2. Customer Relationship Management: Direct bookings foster a connection between the hotelier and guests, allowing for personalized service and better customer retention strategies.

    3. Accumulation of Guest Data: Direct channels enable better collection of customer data, which can be essential for tailoring offers and enhancing the guest experience.

    The Convergence of Technology and Distribution

    The integration of technology has revolutionized how hotels manage marketing and distribution. Advanced software solutions provide insights into customer behavior and peak booking times, empowering hoteliers to make data-informed decisions.

    Technology Tools Enhancing Distribution

    • Channel Managers: These tools automate the distribution of hotel rooms across multiple online travel agencies (OTAs) and direct booking platforms, ensuring that availability and prices are consistent.

    • Property Management Systems (PMS): A robust PMS can streamline operations, from booking management to customer check-in experiences, making it easier for hotels to maintain high service standards.

    The Challenges Ahead

    While the array of strategies offers opportunities, European hoteliers also face significant challenges. The competition from OTAs, changing traveler preferences, and rising operational costs demand that hoteliers continually evaluate and adapt their marketing and distribution strategies.

    Competitive Pressure from OTAs

    Online Travel Agencies (OTAs) like Booking.com and Expedia have significantly altered the booking landscape, often drawing potential customers away from direct channels. To combat this, hotels are exploring innovative strategies to drive direct bookings.

    Adapting to Changing Traveler Preferences

    Today’s travelers seek personalized experiences and instant gratification. This shift necessitates hoteliers to refine their offerings continuously, ensuring that they meet, if not exceed, the expectations of a modern traveler.

    Conclusion

    As the hotel industry in Europe continues to evolve, hoteliers must remain agile in their marketing and distribution approaches. Leveraging multiple marketing tools, investing in direct distribution channels, and embracing technology will be critical for achieving long-term success in this competitive landscape.