الوسم: GDP

  • تزايد استثمارات الدول الأوروبية في الفضاء بنسبة تصل إلى 0.1٪ من الناتج المحلي

    مقدمة عن تطورات الاستثمار في قطاع الفضاء العالمية

    شهدت السنوات الخمس عشرة الماضية تغيرات جذرية في ميزانيات الدول المخصصة للفضاء، حيث قامت العديد من الدول الرائدة في مجال الفضاء بزيادة استثماراتها بشكل كبير، رغم انخفاض التمويل الأمريكي بشكل ملحوظ.

    التراجع الأمريكي في ميزانية الفضاء وإعادة توجيه الاستثمارات العالمية

    على مدى السنوات الماضية، شهدت الولايات المتحدة الأمريكية تراجعاً كبيراً في ميزانيتها المخصصة لقطاع الفضاء. ففي عام 2010، كانت نسبتها من الناتج المحلي الإجمالي تصل إلى 0.13٪، لكنها انخفضت بشكل ملحوظ لتصل إلى حوالي 0.89٪ بحلول عام 2025، مع توقف برامج مثل مكوك الفضاء الأمريكي وتخفيضات في ميزانية وكالة ناسا نتيجة لتغير الأولويات السياسية.

    نشوء وتطور استثمارات الدول الأخرى في مجال الفضاء

    وبالجانب الآخر، انتبهت دول أخرى في منظمة التعاون الاقتصادي والتنمية (OECD) إلى أهمية تطوير قدراتها الفضائية، حيث زادت استثماراتها بشكل كبير لتعويض التراجع الأمريكي.

    من اليابان وإيطاليا إلى أوروبا الشرقية

    تضاعفت ميزانيات اليابان وإيطاليا على حد سواء، مع رفعها إلى حوالي 0.1٪ من الناتج المحلي الإجمالي بين عامي 2010 و2025. اليابان حققت إنجازات مهمة من خلال هبوطها على سطح القمر في عام 2024، بينما تساهم إيطاليا في برامج الفضاء الأوروبية عبر وكالة الفضاء الأوروبية (ESA) وتشارك بفعالية في المشاريع الدولية.

    أما في أوروبا الشرقية، فقد سجلت هنغاريا وبولندا وتشيكيا نمواً ملحوظاً في ميزانياتها الفضائية، حيث وصلت إلى معدلات تتراوح بين 0.03٪ و0.04٪. كذلك، شهدت دول البلطيق وسلوفاكيا استثمارًا متزايدًا، مع بداية نشوء برامج فضائية وطنية أو إقليمية.

    الدول الكبرى في أوروبا وتفاوت استثماراتها في الفضاء

    بالنسبة للدول الأوروبية الكبرى، مثل المملكة المتحدة وإسبانيا وألمانيا، كانت معدلات إنفاقها على الفضاء أقل مقارنة مع فرنسا، حيث تتراوح بين 0.25٪ و0.55٪ من الناتج المحلي الإجمالي، مع نمو معتدل خلال نفس الفترة. فرنسا، التي تعد من أكبر المستثمرين، استثمرت بشكل ثابت مع زيادة ملحوظة بلغت 5٪، حيث خصصت 0.82٪ من ناتجها المحلي الإجمالي لبرامج الفضاء في عام 2025. تشمل استثمارات فرنسا إدارة قاعدة فضائية في غيانا الفرنسية، فضلاً عن دعمها لمشاريع عسكرية فضائية وتطوير تقنيات حديثة في مجالات متعددة.

    الخلاصة: ملامح المشهد الاستثماري في القطاع الفضائي العالمي

    تشير الأرقام والتحولات إلى أن الاهتمام بتطوير قطاع الفضاء يتزايد في مختلف أنحاء العالم، رغم تراجع التمويل الأمريكي، حيث تتجه العديد من الدول إلى تعزيز قدراتها وتقنيات استكشاف الفضاء، مما ينذر بمنافسة دولية أكثر حيوية وتعاوناً متعدد الأطراف في المستقبل.

  • Global Trade Peak at 62.8% in 2022: A Turning Point Ahead?

    Global Trade Peak at 62.8% in 2022: A Turning Point Ahead?

    The Evolution of Globalization: A Historical Perspective

    Globalization, a term that permeates discussions around economics, culture, and politics, refers to the interconnectedness and interdependence of nations through trade, investment, and cultural exchange. This phenomenon has been in motion for decades, profoundly influencing how countries engage with one another. In examining the trajectory of globalization, it’s essential to recognize both its peaks and troughs, which reflect changing geopolitical landscapes.

    Early Years of Globalization

    In the late 20th century, particularly post-World War II, globalization gained momentum as a result of technological advancements and policy reforms. The establishment of international organizations such as the United Nations and the World Trade Organization laid the groundwork for a cooperative global framework. Trade barriers began to fall, and nations recognized the mutual benefits of engaging in international commerce.

    The Impact of the Financial Crisis

    The global financial crisis in 2008 marked a significant turning point for globalization. Following years of growth, confidence in the interconnected global economy faltered. Trade stagnated as countries focused inward, scrutinizing their economic dependencies. The crisis laid bare the vulnerabilities inherent in global supply chains, prompting nations and businesses to rethink their positions within this web of international exchange.

    Nationalism and Protectionism on the Rise

    The Reemergence of Nationalistic Policies

    In recent years, a resurgence of nationalism has posed challenges to globalization. Economic uncertainty, driven by perceptions of inequality and exploitation in the global trade system, has given rise to protectionist sentiments across various countries. Leaders who prioritize domestic interests over international cooperation have emerged, fundamentally altering the landscape of global trade.

    Case Study: The United States and China

    The trade relationship between the United States and China exemplifies the shifting dynamics of global trade. Under the Trump administration, tariffs were introduced as a tool to combat perceived unfair practices, leading to a trade war that disrupted longstanding supply chains. This situation underscores how political decisions can ripple through the global economy, leading to increased tensions and restructuring of trade relations.

    The Covid-19 Pandemic: A Double-Edged Sword

    Initial Setbacks in Global Trade

    The Covid-19 pandemic served as an unforgiving reality check for globalization. As countries closed their borders and implemented lockdown measures, the flow of goods and services drastically declined. In 2020, the global trade-to-GDP ratio fell to its lowest level since 2003, showcasing the fragility of supply chains and the interdependencies built over decades.

    A Quick Recovery and New Challenges

    Despite the initial shock, the world witnessed a remarkable rebound in trade levels post-pandemic. By 2022, the global trade-to-GDP ratio peaked at 62.8%, signifying a resurgence in commerce as economies reopened. However, this upward trend was short-lived, dropping to 58.5% in 2023. The underlying reasons for this decline are multifaceted, including ongoing geopolitical tensions and uncertainty regarding future trade policies.

    The Current State of Globalization: Is It Peaking?

    Analyzing Recent Trends

    The current climate suggests that we may be witnessing the peak of globalization. The circumstances that marked earlier growth, such as low tariffs and collaborative international frameworks, are now under threat. The rise of tariffs, especially in light of the United States’ renewed protectionist policies, compels companies and nations to reassess their participation in global trade.

    The Future of Supply Chains

    As businesses grapple with uncertainties related to tariffs and trade relations, many are reconsidering their supply chain strategies. The lessons learned from the pandemic—regarding vulnerabilities and dependencies—are prompting organizations to seek more resilient and localized supply chains to safeguard against future global disruptions.

    The Role of Economic Uncertainty

    Uncertainty regarding long-term trade policies adds a layer of complexity to the current situation. While some argue that the tariffs introduced in response to global trade issues will not stand the test of time, their short-term impacts may lead companies to fundamentally shift their operational models. This is a pivotal moment in the evolution of globalization, as firms seek to balance the benefits of international trade with the necessity of securing their supply chains.

    The Implications for Future Global Relations

    Possible Scenarios

    As we look ahead, the implications of these developments are significant for international relations. Countries may shift towards more self-sufficient economies, questioning the benefits brought about through previous globalization efforts. Simultaneously, emerging markets might find opportunities within a reshaped environment that favors regional cooperation over global integration.

    Conclusion

    The journey of globalization is marked by growth, challenges, and constant evolution, reflecting broader economic and political sentiments. As we stand at this crossroads, it remains to be seen whether we have reached peak globalization or if a new chapter awaits in the story of global trade and cooperation.

  • Trump’s Tariffs: 0.95% GDP Hit, $2,100 Per Household Tax

    Trump’s Tariffs: 0.95% GDP Hit, $2,100 Per Household Tax

    Understanding the Impact of Trump’s Tariffs

    The Trump administration’s implementation of reciprocal tariffs has been a significant point of contention in economic discussions, particularly given its projected revenue implications and broader economic effects. Announced on April 2, the tariffs have been described as the largest tax hike since 1982, raising questions about their impact on consumers, companies, and the overall economy.

    The Projected Revenue Increase

    According to analysis by the Tax Foundation, these tariffs are expected to generate an additional $290 billion in government revenue by 2025, which translates to approximately 0.95% of the Gross Domestic Product (GDP). However, the dynamics of how tariffs function suggest that the burden is largely borne by U.S. entities. Though the government frames tariffs as taxes on foreign products, it is often the American importers who ultimately absorb these costs. The expectation is that these importers will transfer the increased costs down the line, affecting consumers directly.

    Conventional vs. Dynamic Modeling

    The Tax Foundation utilized conventional revenue estimates based on the new tariffs for its calculations. It anticipates a government revenue increase of $290 billion. However, adopting a dynamic economic model—one that accounts for changes in behavior and the broader impact of tariffs—would lower this estimate to about $244 billion. This reduction considers potential losses in tax income due to decreased personal and business earnings caused by the tariffs.

    Implications for the Overall Economy

    JPMorgan has characterized the tariff strategy as the most significant tax hike since 1968, citing an increase in the overall U.S. tariff rate projected to reach 22% by 2025. In contrast, the Tax Foundation’s estimate is slightly lower at 18.8%. This divergence in projections raises important questions about the long-term viability of the tariffs and their ability to generate expected revenue.

    Potential for Global Recession

    With rising tariffs, concerns regarding global economic stability have been amplified. JPMorgan has reported an increase in the risk of a global recession climbing from 40% to 60% due to these trade policies. This sentiment is echoed across various organizations, including the libertarian Cato Institute, which criticized the tariffs as hidden “massive tax increases” detrimental to free trade.

    Impact on U.S. Incomes

    The Tax Foundation’s analysis further estimates that these tariffs could reduce the average U.S. after-tax income by approximately 2.1%. However, the effect is somewhat less severe for those in higher income brackets, with the 99th and 100th percentiles seeing a smaller decrease of 1.8%. This effective tax increase translates to about $2,100 for the average U.S. household by 2025, leading to a re-evaluation of disposable income and consumer spending.

    Effects on GDP and Employment

    Updates regarding the impact of the tariffs on U.S. GDP and employment forecasts present a bleak outlook. The tariffs imposed on April 2 are projected to lead to a 0.5% decrease in GDP and the loss of nearly 400,000 full-time equivalent jobs. This is in addition to the existing tariffs on other countries, which already contribute to a GDP reduction of about 0.2% and a loss of 270,000 jobs.

    Comparison with Past Trade Wars

    To put these numbers in perspective, analyses of prior trade conflicts, such as the 2018-2019 trade war with China, demonstrate similar detrimental trends. That conflict alone was estimated to reduce GDP by about 0.2% and eliminate approximately 142,000 jobs.

    Conclusion

    In summation, the tariffs announced by the Trump administration have significant implications for U.S. economic health, underscoring the complexity of trade policies and their far-reaching effects on government revenues, employment rates, and consumers’ financial well-being. Understanding these dynamics is crucial not only for policymakers but also for businesses and households grappling with the tangible impacts of such financial decisions.

  • IMF: Russia’s GDP Growth to Slow from 3.8% to 1.2% (2026)

    IMF: Russia’s GDP Growth to Slow from 3.8% to 1.2% (2026)

    Understanding Russia’s Economic Landscape: Growth Projections and Challenges

    The economic environment in Russia has seen considerable fluctuations due to geopolitical events and internal policies. The International Monetary Fund (IMF) provides essential insights into these dynamics, particularly in the wake of the country’s actions in Ukraine and the resulting international sanctions. This blog delves into the specifics of Russia’s economic performance and future projections, as well as the underlying factors driving these changes.

    The Immediate Impact of Sanctions

    A Shrinking GDP in 2022

    Following Russia’s invasion of Ukraine in 2022, the country’s economy faced unprecedented challenges. The IMF estimated a contraction in Russia’s Gross Domestic Product (GDP) by 1.2 percent that year, a direct consequence of extensive sanctions imposed by Western nations. These sanctions primarily targeted critical sectors such as energy, finance, and technology, aiming to exert pressure on the Russian economy.

    Rebound in 2023 and 2024

    Recovery Driven by Government Spending

    Despite the harsh sanctions environment, Russia managed to experience a significant economic rebound in the subsequent years. The IMF anticipates GDP growth of 3.6 percent in 2023 and 3.8 percent in 2024. This recovery can largely be attributed to a marked increase in government spending, particularly within the military sector, as the government sought to reinforce its defense capabilities amid ongoing tensions.

    Consumer Demand and Labor Market Dynamics

    The surge in government expenditure resulted in heightened consumer demand, even as interest rates soared to 18 percent. The tight labor market, characterized by "soaring wages," contributed to a resilient consumer atmosphere, allowing for continued economic activity despite unfavorable financial conditions. Analysts have noted this unusual situation, where heightened government spending coupled with significant wage growth sustained consumer confidence and spending.

    Strategic Redirection of Exports

    Pivoting to New Markets

    Another crucial element influencing Russia’s economic performance has been its strategic redirection of oil and gas exports. Traditionally reliant on Western markets, Russia has increasingly shifted its focus towards countries like India and China. This pivot has helped the nation circumvent some of the negative impacts of sanctions, allowing it to maintain a critical revenue stream despite international isolation.

    Future Projections and Challenges Ahead

    Slowing Growth Expectations

    Looking ahead, forecasts suggest a notable slowdown in Russia’s economic growth. The IMF projects an increase of only 1.4 percent in 2025 and a further decline to 1.2 percent in 2026. These figures indicate a conspicuous shift from the robust recovery experienced in 2023 and 2024.

    Key Challenges Influencing Economic Performance

    Several factors are expected to contribute to this anticipated slowdown. Notable among these are:

    1. Labor Shortages: As the economy continues to evolve in response to sanctions, finding skilled labor could become a significant challenge for various sectors, particularly technology and services.

    2. Rising Prices: Inflationary pressures could hamper consumer spending, impacting overall economic activity.

    3. Ongoing Sanctions Impact: The long-term effects of sanctions, particularly on the tech sector, will likely continue to create hurdles for growth.

    4. Trade Restrictions: These restrictions could limit Russia’s ability to diversify its economy and reduce dependence on energy exports over the long term.

    Conclusion (not included)

  • Greenland’s Economy: 23% GDP from Fishing, 42% from Danish Aid

    Greenland’s Economy: 23% GDP from Fishing, 42% from Danish Aid

    Understanding Greenland’s Economy: The Two Pillars of Sustainability

    Greenland, the world’s largest island, situated between the Arctic and Atlantic Oceans, boasts a unique economy heavily influenced by both its rich natural resources and its political ties with Denmark. A crucial aspect of its economic structure revolves around two main components: the fishing industry and Danish subsidies.

    The Role of the Fishing Industry in Greenland’s Economy

    Fishery Exports and GDP Contribution

    Fishery exports play a pivotal role in Greenland’s economy, accounting for approximately 23% of the country’s Gross Domestic Product (GDP) as of 2023. This statistic highlights the reliance on marine resources for economic stability and growth. In 2023, fishery exports were valued at around 5.3 billion Danish Kroner (DKK), demonstrating the industry’s significance in generating revenue and fostering employment.

    Challenges and Opportunities in the Fishing Sector

    While fishery contributes significantly to the economy, the sector faces challenges such as climate change, overfishing, and regulatory pressures. Nevertheless, there are emerging opportunities as global demand for seafood increases. Greenland’s access to its Exclusive Economic Zone (EEZ) presents prospects for sustainable fishing practices and potential growth in export markets.

    Danish Subsidies: A Lifeline for Greenland’s Economy

    Government Spending and Dependence on Subsidies

    Government expenditure in Greenland reached a staggering 9.6 billion DKK in 2023, constituting 42% of the GDP. This heavy reliance on government funding underscores the challenges the island faces in achieving economic self-sufficiency. Approximately half of government spending is underpinned by Danish subsidies, with the annual grant amounting to roughly 20% of Greenland’s GDP.

    The Complexity of Danish Contributions

    The financial relationship between Greenland and Denmark goes beyond subsidies. For instance, Denmark incurred approximately €204 million in additional expenses in 2023, which encompasses vital resources like police services, military defense, environmental protection, and infrastructure maintenance. Furthermore, Greenland benefits from an annual EU financial contribution of €17.29 million aimed at supporting its fisheries policy and facilitating access to the EEZ.

    The Perspective on Independence and Economic Viability

    Desire for Autonomy vs. Economic Dependency

    The inhabitants of Greenland increasingly express a desire for independence from Denmark, driven by a sense of national identity and self-governance. However, this ambition is juxtaposed with the undeniable economic dependency on Danish support. While autonomy is sought, the sustainability of the economy remains a crucial factor that influences the pace and feasibility of independence.

    Advancements Towards Economic Independence

    A Decrease in Subsidy Reliance

    In recent years, Greenland has made notable strides in reducing its dependency on the Danish block grant. Historical data shows that while the nominal value of the grant has increased from 2.4 billion DKK in 1994 to 4.1 billion DKK in 2023, its proportional share of GDP has decreased significantly—from 30% in 2003 to 19% in 2021. This trend signifies an ongoing effort towards economic diversification and self-sufficiency.

    The Potential of Tourism

    In addition to fishing, tourism stands out as a burgeoning industry in Greenland. Recent statistics indicate a 14% surge in international flight passengers, reflecting growing interest in the island as a travel destination. The expansion of tourism presents an opportunity for economic diversification and a reduction in reliance on traditional sectors.

    Resource Management and Mining Limitations

    The Caution Around Natural Resource Exploitation

    Despite its wealth of natural resources, Greenland has adopted a cautious approach to mining activities, following a decisive referendum where residents voted against large-scale mining operations. The vote underlined the community’s preference for maintaining ecological integrity and sustainable development practices over immediate economic gains.

    Conclusion

    The intricate relationship between fishing, Danish subsidies, and the broader economic landscape shapes the future of Greenland. The pursuit of independence, coupled with the need for economic sustainability, creates a complex dynamic that drives discussions about the island’s long-term development strategy. As Greenland continues to navigate these challenges, its natural resources and evolving industries will play crucial roles in its path toward self-reliance and sustainable growth.

  • OECD: 0.3% Global GDP Drop from 10% Tariff Increase

    OECD: 0.3% Global GDP Drop from 10% Tariff Increase

    Global Economic Outlook: OECD’s Projections for 2025 and 2026

    The Organization for Economic Cooperation and Development (OECD) recently released its economic outlook, revealing troubling signs in the global economic landscape. The report, published on January 9, 2025, highlights substantial downward revisions in global growth projections for the years 2025 and 2026. These adjustments reflect ongoing political and economic uncertainties that are reshaping investment and consumption patterns worldwide.

    Revised Global GDP Growth Projections

    Key Changes in Projections

    In its latest appraisal, the OECD downgraded the anticipated global GDP growth for 2025 from an earlier estimate of 3.3% to 3.1%. Similarly, the forecast for 2026 was also reduced from 3.3% to 3.0%. This cautious outlook underscores the challenges that economies face as they navigate a complex international environment.

    Factors Behind Downgrades

    Lingering Inflation

    One of the central themes affecting economic growth is persistent inflation. As consumers and businesses adjust to rising prices, spending patterns become more conservative, influencing overall economic momentum. The OECD’s outlook emphasizes how inflation continues to pose a significant risk not only to macroeconomic stability but also to individual purchasing power.

    Increased Trade Barriers

    Another critical factor contributing to the downward revision is the rise of trade barriers. The OECD highlights that any further escalation in trade restrictions, particularly tariffs, can significantly hinder global economic growth. The imposition of new tariffs not only disrupts international supply chains but also reduces trade flows, which are vital for economic growth.

    The Impact of Trade Wars

    Potential Consequences of Increased Tariffs

    The OECD’s report provides alarming insights into how trade wars could unfold in the coming years. For instance, a hypothetical 10% increase in tariffs on all non-commodity imports to the United States, matched by equivalent tariffs on imports from the U.S., could trigger a decline in global GDP by approximately 0.3% by the third year compared to baseline projections.

    Regional Impacts

    The study reveals that the United States, alongside its North American trade partners—Canada and Mexico—would be disproportionately affected by these trade tensions. The potential GDP losses projected for these countries are striking: the U.S. could see a reduction of 0.7%, Canada 0.6%, and Mexico a staggering 1.3%. Such estimations indicate that the ramifications of a trade war extend beyond tariffs, affecting overall economic health.

    Inflationary Pressures from Tariffs

    Increased Inflation Rates

    In addition to the GDP implications, the OECD’s outlook addresses the inflationary effects of increased tariffs. It predicts that an additional 10% increase in tariffs could lead to a rise in global inflation by 0.4 percentage points annually for the first three years. In the United States specifically, inflation could spike even more, potentially increasing by 0.7 percentage points per year in response to new tariffs.

    Consequences for Consumers

    The inflationary pressures driven by tariffs can pose serious challenges for consumers and businesses alike. Increased prices can stifle consumer spending, leading to a compounding effect on economic growth. As consumers face higher costs, their ability to make discretionary purchases diminishes, thereby affecting overall economic vitality.

    The Trade War Dilemma

    No Winners in a Trade War

    The overarching message from the OECD’s findings is clear: there are no winners in a trade war. The affected countries, particularly those imposing tariffs, are likely to face significant economic drawbacks. The report underscores the paradox of protectionist policies, which, while aimed at bolstering domestic industries, can ultimately hinder economic growth.

    U.S. as a Major Loser

    Amidst this backdrop, the United States emerges as one of the biggest potential losers from a trade war. The report illustrates how the U.S. is not only at risk of facing reduced GDP growth and heightened inflation but also of undermining its own economic stability in the longer term.

    Conclusion on the Trade Tensions’ Broader Implications

    The OECD’s recent economic outlook serves as a sobering reminder of the interconnectedness of global economies. As trade tensions simmer and uncertainties proliferate, the implications for growth, inflation, and consumer welfare become increasingly pronounced. Understanding these dynamics is crucial for policymakers, businesses, and consumers alike as they navigate the complexities of an evolving economic landscape.

  • U.S. Tariffs: Canada Faces 0.39% GDP Drop, Mexico 0.19%

    U.S. Tariffs: Canada Faces 0.39% GDP Drop, Mexico 0.19%

    Understanding the Impact of Steel and Aluminum Tariffs on U.S. Trade Partners

    The implementation of the 25 percent tariffs on steel and aluminum imports by the Trump administration has raised numerous concerns about its ramifications not only on the U.S. economy but also on its trading partners. This blog delves into how these tariffs affect neighboring countries such as Canada and Mexico, as well as the broader implications for economies within the European Union.

    The Context of Tariffs

    The imposition of tariffs on imported steel and aluminum was framed as a move to protect domestic industries and secure American jobs. However, the ripple effects of these tariffs extend far beyond U.S. borders and impact global trade dynamics. Understanding the fallout from these decisions requires a closer examination of projected economic outcomes for U.S. neighbors and allies.

    Projected Economic Impact on Canada

    The Vulnerability of Canada’s Economy

    Canada stands out as one of the most affected countries by these tariffs, with estimates indicating a real GDP decline of approximately 0.39 percent. The close economic ties between the U.S. and Canada—especially concerning the steel and aluminum sectors—illustrate how intertwined their markets are.

    Dependency on U.S. Markets

    Given that Canada’s steel and aluminum industry is heavily reliant on exports to the United States, the tariffs pose a significant threat to Canada’s economic stability. As trade barriers rise, Canadian manufacturers may struggle to compete, affecting employment and economic growth in the region.

    The Impact on Mexico

    Economic Consequences for Mexico

    Mexico, another vital U.S. trade partner, is projected to experience a real GDP decline of about 0.19 percent due to the tariffs on steel and aluminum. Similar to Canada, Mexico relies on trade with the U.S., particularly in manufacturing sectors that utilize steel and aluminum.

    Broader Trade Relationships

    The tariffs not only challenge Mexico’s economic landscape but also strain the economic cooperation that exists under agreements such as the USMCA (United States-Mexico-Canada Agreement). The repercussions could lead to a reevaluation of trade relations, impacting various sectors beyond metals.

    Effects on the European Union

    A Mild Economic Decline

    In comparison, the European Union (EU) is expected to experience a short-term decline of approximately 0.02 percent in real GDP due to the tariffs. While this reduction seems minor on the surface, it signals deeper challenges in maintaining strong trade links with the U.S.

    Germany’s Heavy Hit

    Among EU countries, Germany is projected to face significant challenges, particularly in the automotive industry, which relies on high-quality materials such as steel and aluminum. A projected 0.03 percent decline in the German economy underscores the fragility of exports and the potential for broader economic repercussions throughout Europe.

    The Domestic Impact of Tariffs on the U.S. Economy

    Rising Production Costs

    While the intent of the tariffs might be to bolster domestic industries, the reality is that they can lead to increased production costs for U.S. manufacturers. As imports dwindle and domestic production scales up, manufacturers may experience a significant cost burden, which is likely to be passed on to consumers.

    Declines in U.S. Exports

    Research indicates that U.S. exports could decrease by an estimated 1.37 percent as companies shift their focus to meeting domestic demands in light of decreased imports. This shift not only impacts trade balances but can also lead to reduced competitiveness in the global market.

    Overall Economic Ramifications

    The cumulative effects of elevated costs for businesses and reduced exports are projected to lead to an estimated 0.04 percent decline in U.S. GDP. This decline highlights the interconnectedness of global trade systems and the potential for domestic policies to yield unintended consequences.

    Conclusion

    As nations navigate the complexities of tariff implementation, the broader implications underscore the need for thoughtful policy considerations. The interconnected nature of modern economies means that decisions made in one country can yield significant effects on others, especially among closely tied trade partners.

    Understanding these dynamics is essential not only for policymakers but also for businesses and consumers who are directly impacted by these changes. The conversation surrounding trade tariffs continues to evolve, and ongoing analysis will be essential to grasp the full scope of their impact.

  • EU Must Boost Defense Spending by 1.5% to Deter Russia

    EU Must Boost Defense Spending by 1.5% to Deter Russia

    The Rising Call for Increased EU Defense Spending

    As tensions with Russia escalate and the geopolitical landscape shifts, the European Union (EU) finds itself at a crossroads regarding its defense strategy. Recent events, including a high-profile meeting at the White House, have underscored the need for Europe to reassess its military commitments and spending in light of the ongoing conflict in Ukraine.

    The Context of EU Defense Spending

    The backdrop of this discussion is a significant moment where European leaders reassured Ukraine of their unwavering support following a controversial meeting involving U.S. leaders and Ukrainian President Volodymyr Zelensky. The crux of the meeting highlighted a worrying trend: a potential decrease in U.S. military support for Ukraine. This shift casts doubt on Europe’s reliance on the U.S. for military backing, prompting urgent dialogue across EU nations about bolstering their defense capabilities.

    Financial Implications of Defense Spending

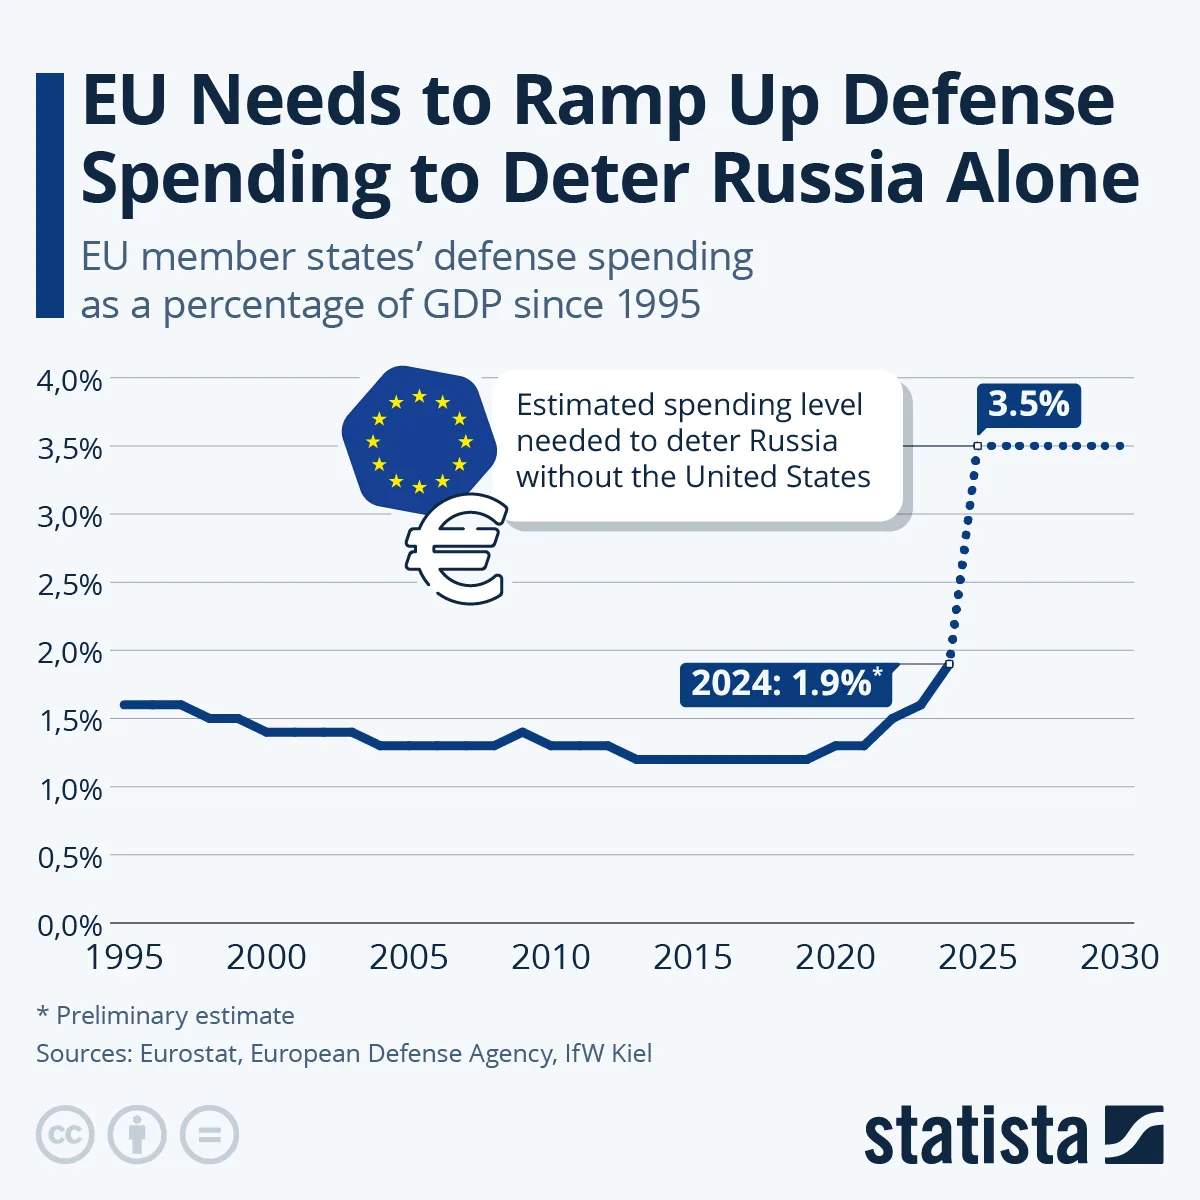
    According to research from the Kiel Institute for the World Economy, the European Union must significantly ramp up its military expenditures to effectively replace U.S. contributions and act independently in defense operations. Preliminary estimates suggest that the EU would need to allocate an additional 0.12% of its GDP annually to match the U.S. military assistance that has amounted to approximately €64 billion over the last three years.

    The Challenge of Deterring Russia

    However, the need for financial adjustments does not stop at merely compensating for U.S. aid. The researchers further indicate that to genuinely deter Russian aggression and provide substantial support to Ukraine, Europe would have to increase its military spending by about €250 billion each year. This increase would raise the EU’s defense spending from roughly 2% to an ambitious 3.5% of GDP annually.

    Economic Viability of Increased Defense Budget

    Professor Guntram Wolff, a co-author of the analysis, asserts that these financial requirements are manageable within the context of the EU’s economic strength. He remarked that the additional costs would only constitute around 1.5% of the EU’s gross domestic product. For comparison, this figure is considerably less than the financial mobilization required during the crisis of the Covid-19 pandemic, suggesting that Europe has the capacity to absorb increased spending on defense.

    Potential Economic Benefits

    Interestingly, beyond mere defense logistics, this proposed increase in military expenditure may bolster the European economy. A strategic approach that involves debt-financed defense spending could act as an economic stimulus, particularly if these funds are dispersed within EU nations experiencing declining external demand due to U.S. tariffs and ongoing trade disputes. The interplay of military investments and economic growth could provide a dual benefit for the region – enhancing both security and financial stability.

    Historical Spending Patterns in Defense

    Historically, the EU has maintained a defense spending average hovering around 1.5% of GDP for the past three decades. The data from Eurostat and recent estimates from the European Defence Agency illustrate the significant shift required to meet the new defense spending benchmark necessary to ensure regional stability.

    The Path Forward for EU Defense Initiatives

    As Europe navigates its complex security landscape, the necessity for a robust and independent defense framework has never been clearer. The challenges posed by potential reductions in U.S. military aid necessitate urgent and strategic dialogue among EU members regarding defense contributions and spending. The careful analysis of financial implications, coupled with the potential benefits to the European economy, positions this discourse at the forefront of contemporary EU policy considerations.

  • 2024 Remittances: 45.4% of Tajikistan’s GDP Dependent

    2024 Remittances: 45.4% of Tajikistan’s GDP Dependent

    The Growing Significance of Remittances in the Global Economy

    Remittances have become a vital source of income for many low- and middle-income countries, playing a crucial role in their economic development and stability. Recent data from the World Bank highlights the upward trend in remittance inflows, showcasing their increasing importance in the global economic landscape.

    Overview of Remittance Inflows in 2024

    In 2024, remittance inflows to low- and middle-income countries reached a staggering $685 billion, a notable increase from $647 billion in the previous year. This growth trend reflects a wider global increase in remittances, which totaled an impressive $905 billion. These figures underscore the critical financial lifeline that remittances provide to millions of families around the world, bolstering household incomes and contributing to national economies.

    Top Recipients of Remittances

    Major Players

    India continues to dominate the remittance landscape, receiving $129 billion in 2024, followed by Mexico at $68 billion and China at $48 billion. These countries represent the largest recipients of remittances, benefiting significantly from the financial support sent home by their diaspora abroad.

    Economic Impact on Smaller Economies

    While the absolute figures are noteworthy, the real story lies in how remittances impact smaller and poorer economies. For many of these nations, remittances constitute a substantial portion of their GDP, illustrating their dependence on these funds. For instance, Tajikistan stands out as a prime example, with remittances accounting for a staggering 45.4 percent of its GDP in 2024. This dependency is often linked to the increasing demand for migrant workers in Russia, which has become a key destination for Tajik labor.

    Remittances and Fragility in Economies

    The Fragility Context

    An analysis from the OECD reveals a troubling intersection between remittance dependence and economic fragility. Among the top contexts where remittances constitute the largest share of GDP, three out of four were categorized as highly fragile nations. This suggests that reliance on remittances can often coincide with underlying socio-economic vulnerabilities, where external financial support becomes crucial for survival.

    Case Studies

    Nicaragua, for instance, has experienced substantial remittance inflows, amounting to 27.2 percent of its GDP. The driving forces behind this trend include prolonged economic and political instability, which has prompted many Nicaraguans to migrate, predominantly towards the United States. Meanwhile, Honduras, previously recognized for its high fragility, has seen changes in its classification but remains a significant context of remittance dependence.

    The OECD’s Findings

    The OECD’s research identified 14 out of 61 highly or extremely fragile contexts in 2023 where remittances constituted over 10 percent of GDP. This finding highlights the critical nature of remittances in sustaining economies that are vulnerable to various forms of instability.

    Conclusion

    As remittances continue to grow in significance for developing economies, understanding their implications on both a macroeconomic scale and individual livelihoods is essential. The dependence on remittances raises important questions about the resilience and sustainability of these economies in the face of global economic shifts and local challenges. The evolving dynamics will be crucial in shaping policies that leverage the potential of remittances while addressing the fragility they often accompany.

  • India’s GDP Growth Falls to 5.4% Amid Economic Challenges

    India’s GDP Growth Falls to 5.4% Amid Economic Challenges

    India’s Economic Landscape: Analyzing Recent Growth Trends

    India’s economic journey has been nothing short of remarkable over recent years. However, recent data reveals a concerning trend that could shape the country’s economic future. This blog delves into the nuances of India’s GDP growth, examining the factors contributing to its slowdown and what it means for the nation going forward.

    Quarterly GDP Growth: A Shift in Momentum

    Year-Over-Year Performance

    After displaying robust year-over-year growth in 2023, India’s economic expansion faced significant challenges in 2024. From June to September 2024, the country recorded a GDP growth rate of only 5.4%. This figure marks a critical downturn, representing the lowest quarterly growth since the last quarter of 2022. It stands in stark contrast to projections by economists, who had anticipated a growth rate of 6.5%.

    The Analysts’ Predictions

    Underwhelming Projections

    Economists surveyed by Reuters predicted a more optimistic growth trajectory. Their forecasts suggested that India’s economic momentum would continue into 2024, buoyed by various sectors. However, the actual results fell short of these expectations, highlighting potential vulnerabilities in the national economy.

    Moreover, Reserve Bank of India officials estimated a slightly higher growth of 6.8%, indicating a divergence between institutional predictions and reality.

    Exploring the Causes of Slowdown

    Urban Consumption Challenges

    A key factor explaining this economic deceleration is a notable decline in urban consumption, which has reached a two-year low. The rise in food prices has significantly impacted consumer spending, making it more challenging for the average Indian to maintain previous consumption levels. As urban areas grapple with inflated costs, the ripple effects can be felt throughout different sectors, including retail and services.

    Manufacturing and Utility Outputs

    Another contributing dynamic comes from performance within the manufacturing and utility sectors. According to an analysis by Trading Economics, outputs from these industries have not met previous quarter benchmarks, limiting overall economic growth. The interdependence of various sectors means that weaknesses in manufacturing, often a cornerstone of economic stability, have far-reaching consequences.

    Comparative Economic Rankings

    India Vs. Other Emerging Markets

    Despite these challenges, India remains in a favorable position on the global economic stage. The International Monetary Fund (IMF) recently projected India’s GDP growth for 2024 to be at an impressive seven percent. This rate positions India as a leader among emerging markets, even surpassing growth forecasts for major competitors such as China.

    Long-Term Projections

    While the immediate data reveals a worrying slowdown, projections suggest that India could still emerge as one of the world’s fastest-growing economies in the coming years. This perspective is vital for potential investors and policymakers who wish to navigate the uncertainties of an evolving economic landscape.

    Conclusion

    While the statistics paint a cautious picture of India’s economic health, the broader prospects remain encouraging. An analysis of both current difficulties and future potential underscores the complexity of India’s economic environment. As we dissect these trends, continued monitoring of key economic indicators will be crucial in understanding the opportunities and challenges that lie ahead.

    The unfolding narrative of India’s economy will undoubtedly continue to attract interest as stakeholders navigate both the immediate hurdles and the longer-term aspirations of one of the world’s largest emerging markets.

  • Travel & Tourism: 25% of Croatia’s GDP Sparks Europe’s Economy

    Travel & Tourism: 25% of Croatia’s GDP Sparks Europe’s Economy

    The Economic Significance of Travel and Tourism in Europe

    Travel and tourism play a pivotal role in shaping the economic landscape of Europe. With its rich history, diverse cultures, and breathtaking landscapes, Europe stands as a premier destination for travelers from around the globe. According to reports from the World Travel & Tourism Council (WTTC), the impact of this sector on European economies is both substantial and multifaceted.

    Overview of Travel and Tourism Impact

    The tourism industry encompasses a wide array of services, including accommodation, transportation, food and beverage, entertainment, and excursions. Together, these components contribute significantly to national and regional economies. In many European countries, tourism is not only a source of income but also a major employer.

    Contribution to GDP

    One of the most compelling statistics highlighting the importance of the tourism sector is its contribution to the Gross Domestic Product (GDP) of various nations. Countries like Croatia exemplify this trend, where travel and tourism accounted for over a quarter of its GDP in 2023. This level of contribution showcases how crucial tourism is for the economic vitality of nations.

    Regional Variations

    The extent of tourism’s contribution to GDP can vary widely across different regions in Europe. Countries with significant natural attractions, such as Switzerland and Austria, see a high percentage of their economic output stemming from outdoor and leisure tourism. In contrast, urban destinations like Paris and Rome experience considerable impact from cultural and historical tourism.

    Employment Opportunities

    The tourism sector is a substantial source of employment across Europe, providing jobs for millions. It spans various skill levels, from entry-level positions in hospitality to high-skilled jobs in management and service delivery. The jobs created extend beyond direct tourism roles; they also stimulate employment in related sectors, such as retail, transportation, and services.

    Case Study: Croatia

    Focusing on Croatia, the tourism industry is a cornerstone of its economy. The stunning Adriatic coast, rich culinary heritage, and cultural festivals attract millions of visitors each year. The high percentage of GDP attributed to tourism indicates a heavy reliance on this sector for economic stability and growth. Additionally, the seasonal nature of tourism in Croatia presents both opportunities and challenges, necessitating strategies for year-round economic sustainability.

    Economic Diversification

    Many European nations are leveraging the strengths of their travel and tourism sectors to diversify their economies. By investing in infrastructure, promoting eco-tourism, and enhancing cultural experiences, countries are not only attracting tourists but creating a more resilient economic environment. This diversification is critical in the face of challenges such as economic disruptions or global crises like the COVID-19 pandemic.

    Challenges Facing the Sector

    Despite its successes, the travel and tourism industry in Europe faces numerous challenges. Factors such as geopolitical tensions, climate change, and economic fluctuations can impact travel behavior. Additionally, the rise of sustainable travel poses a significant challenge, as there is increasing pressure on the industry to adopt environmentally friendly practices that can sometimes conflict with profit motives.

    Adapting to Change

    In response to these challenges, many European nations are innovating to ensure the resilience of their tourism sectors. This includes investing in sustainable practices, enhancing digital marketing strategies, and fostering partnerships with local communities to create authentic travel experiences. Such adaptations are not only vital for attracting tourists but also play a crucial role in preserving cultural heritage and natural resources for future generations.

    Future Prospects

    Looking ahead, the travel and tourism industry in Europe is poised for continued growth. With advancements in technology, evolving consumer preferences, and a renewed interest in unique travel experiences, the sector’s potential remains vast. Furthermore, as countries focus on sustainable tourism practices, there is an opportunity to enhance the long-term viability of this crucial economic contributor.

    By embracing innovative strategies and prioritizing sustainable practices, Europe can continue to thrive as a leading travel destination, enriching both its economies and the lives of those who visit.

  • IMF Forecasts 4.4% Growth in Asia, Slowing by 0.2% in 2025

    IMF Forecasts 4.4% Growth in Asia, Slowing by 0.2% in 2025

    IMF Forecasts Growth in Asia to Slow in 2025

    The recent findings from the International Monetary Fund (IMF) have painted a nuanced picture of Asia’s economic landscape for the upcoming years. The October World Economic Outlook highlights a slight deceleration in growth, yet affirms the continued dominance of Asia as a key driver of global economic expansion.

    Expected Growth Rates Across Asia

    According to the IMF, the growth rate in Asia is projected to experience a minor slowdown of 0.2 percentage points, bringing it to a forecasted 4.4% for 2025. This figure significantly surpasses the global average expected growth of 3.2%. Despite the anticipated slowdown, Asia is still positioned to be the "world’s engine of growth," reflective of its robust economic drivers.

    Country-Specific Growth Projections

    Economic Acceleration in Key Nations

    Certain countries in the region are set to witness economic acceleration. The Philippines, Indonesia, Thailand, and Japan are all expected to see increased real GDP growth in 2025. This trend suggests recovery and resilience in these economies, potentially bolstered by various domestic and external factors.

    Japan’s Economic Outlook

    Japan’s growth forecast has experienced a notable change, dipping from 1.7% in 2023 to 0.3% in 2024. This reduction can be attributed to significant supply disruptions within the automotive sector, in addition to fading contributions from one-off post-pandemic tourism spikes that had previously helped drive growth. However, the IMF anticipates that Japan will bounce back with a growth of 1.1% in 2025, benefiting from expected improvements in real wage growth that will stimulate private consumption.

    Challenges Ahead for Major Economies

    Slowdown in China and India

    On the contrary, economic growth in China, India, and Malaysia is forecasted to slow, though they are expected to maintain a resilient presence in the global economy.

    In China, ongoing challenges in the property sector have continued to hamper investment. The weak consumer sentiment has further compounded these issues, as private consumption dwindles amid low confidence levels. The IMF has taken note of new fiscal measures and housing policies introduced by Chinese authorities, indicating potential for recovery, particularly in 2025 when these measures may bear fruit.

    India’s Resilience Despite Slowdown

    India is also facing a slowdown in growth. However, its economy remains characterized by resilience, positioning it favorably in the Asian economic landscape. While specific growth figures are not detailed, India’s economic strategy and demographic advantages contribute to ongoing positive outlooks despite various challenges.

    Risks Affecting Asia’s Economic Projections

    Krishna Srinivasan, the IMF Director for the Asia and Pacific Department, articulated key risks that may impact the optimistic growth forecasts for Asia. Central among these is the current weakness in domestic demand within China, which poses a significant challenge. Concerns over a potential reduction in global demand—especially from critical economies like the United States—could further complicate the landscape for Asia, especially given the region’s export-dependent economic structures.

    Conclusion

    The IMF’s projections for 2025 underscore a complex and interwoven narrative of growth and stagnation within Asia. While certain nations are poised for acceleration, larger economic trends and country-specific challenges will determine the overall resilience of the Asian economy.

  • Public Debt Reaches 121% of GDP in U.S., 90.1% in China

    Public Debt Reaches 121% of GDP in U.S., 90.1% in China

    The Growing Public Debt Landscape: Insights from the U.S., EU, and China

    Public debt has become an increasingly pressing issue globally, especially as countries recover from the ramifications of the COVID-19 pandemic. Recent estimates from the International Monetary Fund (IMF) shed light on the current state of public debt in key global economies: the United States, the European Union (EU), and China.

    Current Public Debt Levels in Major Economies

    As of October 23, 2024, the levels of public debt as a percentage of Gross Domestic Product (GDP) are notably high in all three economies:

    • United States: 121% of GDP
    • China: 90.1% of GDP
    • European Union: 82.7% of GDP

    These figures showcase a concerning trend in public finance, with each region facing its unique challenges and opportunities.

    Historical Context: Public Debt During the Pandemic

    The onset of the coronavirus pandemic in 2020 had significant financial repercussions worldwide. In the United States, public debt surged to approximately 132% of GDP by 2020, reflecting a drastic increase of nearly 24 percentage points compared to 2019 levels. This swift rise highlighted the pressures placed on government budgets as they sought to mitigate the impact of the pandemic through financial support to individuals and businesses.

    Comparative Analysis of Debt Increase

    While the U.S. experienced a substantial spike in debt during the pandemic, the increases in public debt for the EU and China were less dramatic. As countries grappled with the economic upheaval, the level of debt growth varied based on government responses and pre-existing fiscal conditions.

    Trends in U.S. Public Debt Post-Pandemic

    In a surprising turn, the U.S. saw a significant decrease in public debt as a percentage of GDP in 2021, dropping by 7.3% compared to 2020. This decline illustrated a potential recovery phase as the economy stabilized and recovery measures began to take effect.

    However, the overall trend in the previous years suggests that the increase in public debt is a critical concern moving forward, with renewed attention required to ensure fiscal sustainability and economic resilience.

    China’s Persistent Debt Growth

    Contrasting sharply with the U.S., China has experienced a steady increase in public debt from 2020 to 2024. The government’s strategy of fueling economic growth through substantial credit-financed investments has contributed to this increasing trajectory. While such policies can stimulate growth, they also raise concerns about an escalating national deficit.

    Understanding Public Debt and Its Implications

    Public debt is a multifaceted issue, often expressed in absolute terms in the national currency. However, more critical is the debt ratio, which compares government debt to the country’s GDP. This ratio is vital for understanding the sustainability of a country’s fiscal position.

    Budget Deficits vs. Surpluses

    Fundamentally, public debt arises when government expenditures exceed revenues, resulting in a budget deficit. Conversely, a budget surplus occurs when revenues surpass expenditures. Managing these dynamics is essential for maintaining a stable economic environment and ensuring long-term financial health.

    Conclusion

    As public debt continues to climb across major global economies, the need for prudent financial management and strategic policy-making becomes ever more crucial. Each country faces unique challenges, and the paths chosen to navigate these issues will significantly shape their respective economic landscapes in the coming years.

  • IMF: Global Growth Steady at 3.2% for 2024-2025

    IMF: Global Growth Steady at 3.2% for 2024-2025

    Global Economic Growth Outlook for 2024-2025

    As we look ahead to the coming years, the International Monetary Fund (IMF) has released its October World Economic Outlook, shedding light on the anticipated global economic trajectory for 2024 and 2025. The overarching theme of this report is the expectation of stable yet subdued growth, projected at 3.2% over the next two years. This steady growth comes amidst a myriad of challenges that different economies face, including potential contractions in some of the world’s largest economies.

    Key Economic Forecasts

    According to the IMF’s analyses, several major economies are expected to contract during the forecast period. These include India, China, Russia, and the United States. Notably, Russia is expected to experience a significant downturn, with an economic contraction projected at 2.3 percentage points.

    Performance by Country

    1. United States
      • The U.S. economy is projected to witness a growth revision from 2.6% to 2.8% in 2024. However, growth is expected to taper to 2.2% in 2025 due to tightening fiscal policies and a cooling labor market that may curtail consumer spending. This is an improvement from earlier projections which estimated a growth of just 1.9%.
    2. Euro Area
      • The forecast for the eurozone also reflects a decline, with growth rates revised down to 0.8% for 2024 and 1.2% for 2025, compared to previous projections of 0.9% and 1.5% respectively. Germany, in particular, is expected to face stagnation in 2024, a downgrade from the initial forecast predicting a growth of 0.2%.
    3. India
      • India’s economic growth is projected to decelerate from 8.2% in 2023 to 7% in 2024, and further down to 6.5% in 2025. This moderation indicates a potential cooling of the previously robust growth that characterized the Indian economy.
    4. China
      • The economic outlook for China suggests a more gradual slowdown. Despite ongoing issues like weakness in the real estate sector and low consumer confidence, the IMF notes surprisingly strong performance in net exports.

    Notable Revisions Since Previous Outlook

    The current projections reflect several notable revisions from the earlier July 2024 World Economic Outlook. While the U.S. forecast has been upgraded, the revisions for other advanced economies have been more pessimistic. Germany’s anticipated stagnation and weaker growth projections for the eurozone illustrate the struggles faced by these economies amid shifting economic conditions.

    Risks to Economic Stability

    The IMF has highlighted several risks that could undermine economic growth. Notably, the potential for new spikes in commodity prices due to ongoing geopolitical tensions remains a significant concern. Additionally, there is a daunting risk if China faces a deeper or prolonged contraction in its property sector, which could have ripple effects across global supply chains and demand.

    Global Economic Environment

    The global economic environment is shaped by a combination of factors, including geopolitical conflicts, commodity price fluctuations, and gradual adjustments in consumer behavior. As national governments navigate these challenges, the resulting policies will be crucial in shaping the economic landscape for both advanced and emerging economies.

    In summary, while the IMF projects stable growth at 3.2% for 2024 and 2025, the realities on the ground reflect a complex interplay of opportunities and challenges that will define the global economy in the coming years.